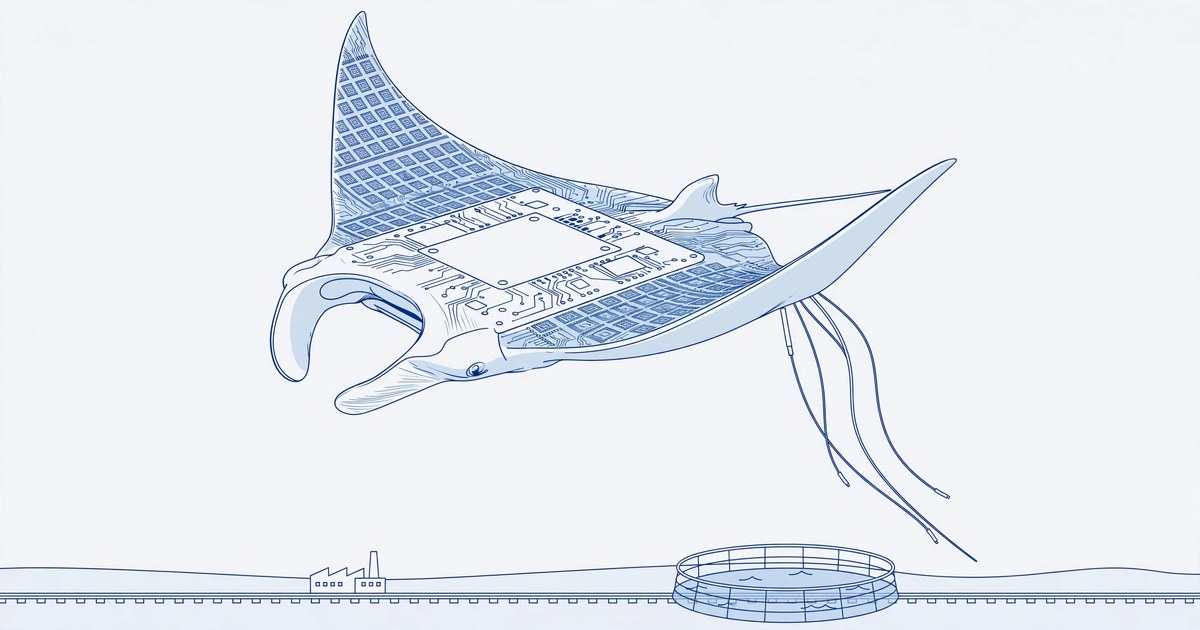
As the US and China Contest the Future of AI, What Is Japan Losing?
The US holds the models, the platforms and chip design. China holds scale, deployment and speed. Japan holds upstream steps that no advanced chip can bypass. But an indispensable supplier is not the same as the one who writes the next rules. Measured with the same yardstick across the three countries, this article tests whether Japan's advantages can still buy it a position.
Pages · 1/7
As the US and China contest the future of AI, what is Japan losing?
59
Notable AI models — United States (2025)
35
Notable AI models — China (2025)
0
Notable AI models — Japan (2025)
In factories that year, China installed about 59% of the world's new robots while Japan's installations fell 19%; among firms, 27.0% of Japanese companies had made no organisational effort on AI — the highest of the four countries surveyed (Japan, the US, Germany and China).
Our preliminary finding in one sentence: Japan's traditional strengths are intact, but strength and influence are decoupling. We test it with three questions — who sets the technology, who makes the money, who can act alone.
Pages · 2/7
The global contest: not a ranking, a map of gaps
The rows map to the three questions: technology in the first two, independence in the third, money in the last two. Years are marked on each row.
| What to look at | United States | China | Japan |
|---|---|---|---|
| Models & platforms · 2025 | 59, platforms in hand | 35, self-contained | 0, platforms rented |
| Advanced chips · 2025 | Leads design and EDA | 7nm class, no EUV | Zero domestic production |
| Key equipment & materials · 2025 | Vendors ranked #2, #3 | Largest buyer, substitution accelerating | Leads six steps |
| Industrial deployment · 2025 | #2 (38,500) | #1 (354,000) | #3 (36,219) |
| Commercialisation · early-2026 survey | 35.6% company-wide | 40.9% company-wide | 27.0% no organisational effort |
Beyond the trio sit TSMC (69.9% of foundry), SK hynix (over half of HBM) and ASML (sole EUV supplier). Count them in and the gap sharpens: the rule-setting things are concentrated in models, platforms and design — exactly what Japan lacks.
Pages · 3/7
What Japan still controls: six upstream steps
Add the industrial base: Japan builds 38% of the world's robots, with a stock of about 450,000 units (end-2024).
But this page's real question is not share: does holding the chokepoints of production mean you get to write the next generation's rules?
Pages · 4/7
The pressure is growing — and accelerating
35
China's notable AI models (15 in 2024 → 35 in 2025)
35%
China's equipment self-sufficiency (25% in 2024 → 35% in 2025)
−19%
Japan's robot installations (2025), rank falls to third
Chinese suppliers now install 55% of China's new robots, and the performance gap between the top US and Chinese models is down to 2.7%. Statically, most of Japan's shares still hold; but every direction of change runs against it.
Pages · 5/7
Three futures — which one arrives?
A · The high-value supplier — the upstream holds, the money keeps coming; the rules are written by others. The default drift.
B · Home ground in niches of physical AI — an ecosystem of its own in factories and care. The highest ceiling, but it must fight China's costs and America's platforms at once.
C · Continued relative decline — the upstream eroded step by step, applications depending deeper on overseas. Not yet reality; the densest signals.
What supports each scenario, and what would overturn it, is listed with dates and numbers in the text. We invent no probabilities.
Pages · 6/7
The unanswered question
Our provisional judgment fits in one sentence: Japan has not lost all its chips, but manufacturing strength no longer automatically equals a place in the next generation — it is more likely to become a high-value supplier than a rule-setter. This judgment awaits verification; the four dates in 2027–2028 that could revise it are listed in the judgment section of the text.
The core contradiction is left with the reader: if the world depends ever more on Japan's materials, equipment and robots, while the rules for how they are used are written elsewhere — does being indispensable count as influence?
Pages · 7/7
Japan has not lost all its chips in the AI contest: the upstream steps and the industrial field are still in its hands. But on who sets the technology, who makes the money, and who can act alone, the evidence points the same way — Japan is stepping back from rule-setter to high-value supplier. That is not a claim that decline is settled. It is a claim that the assumption "manufacturing strength carries over automatically to the next generation" has been falsified by the data.
Notable AI models in 2025: US 59, China 35, Japan 0. Robot installations: China took ~59% while Japan fell 19% to third. We test, with three questions — who sets the technology, who makes the money, who can act alone — whether Japan's upstream importance is enough to keep its place.
Key takeaways
- Separate two kinds of decline: this article is about relative decline — Japan is still growing, but the US and China are moving faster and Japan's position is diluted passively (developed in the introduction).
- Technology leadership: notable models in 2025 — US 59, China 35, Japan 0 (Epoch classification; 0 does not mean Japan develops no models, it means none entered the global frontier tier). The US–China performance gap has narrowed to 2.7%; that chase does not involve Japan.
- Japan's upstream importance is real: six unavoidable steps led, the world's largest robot production. But importance is decoupling from bargaining power — the top five Japanese equipment makers' China sales fell for the first time, and a historic share peak proves nothing about future pricing power.
- The pressure is dynamic: China's equipment self-sufficiency +10 points in a year, domestic robot suppliers at 55% of home installations, Japan's home installations down 19% to third place in 2025. Static shares hold; the directions of change do not favour Japan.
- On making money, Japan is the weakest of the three: breadth of corporate AI use in Japan is not low (86.4% within the survey sample), but company-wide rollouts are only 21.5% and 27.0% make no organisational effort — the highest of four countries. Using AI is not the same as earning from AI.
- The provisional judgment is pessimistic but falsifiable: if 2027–2028 brings a Japanese model entering the frontier tier, an expanded chokepoint list, or the paid procurement and physical-AI cluster delivered on schedule, we will revise the pessimism down. The indicators are listed in the judgment section.
Japan has not lost all its chips in the AI contest: the upstream steps and the industrial field are still in its hands. But on who sets the technology, who makes the money, and who can act alone, the evidence points the same way — Japan is stepping back from rule-setter to high-value supplier. That is not a claim that decline is settled. It is a claim that the assumption "manufacturing strength carries over automatically to the next generation" has been falsified by the data.
The rule-setter (United States)
Frontier models, agent platforms and cloud (Microsoft, OpenAI, Anthropic, Google), chip design and EDA — all in hand. It sets routes and interfaces, and collects platform rent. Its weakness is manufacturing — advanced capacity sits with TSMC, robot hardware is imported.
The scale challenger (China)
Notable models more than doubled in a year with performance closing in, the largest equipment buyer, the world's biggest robot deployment. It trades scale for speed and deployment for data. Its weakness is advanced manufacturing — no EUV, its most advanced production at 7nm class, chips still heavily imported.
The high-value supplier (Japan)
Six unavoidable upstream steps, the world's largest robot production, a deep stock of precision manufacturing. It sells what every generation of technology must pass through. Its weakness is distance from the rules — no frontier models, platforms rented, zero advanced capacity.
Other pivotal players on the chain
TSMC (69.9% of foundry), Samsung and SK hynix (the HBM trio), ASML (sole EUV supplier). Beyond the three-country story, they set the practical boundaries of "advanced chips" — every country's position has to be read on this map.
In 2025 the United States released 59 notable AI models, China 35, Japan 0. "Notable" is Epoch AI's filter (see section 2). In factories that year, China installed about 59% of the world's industrial robots, while Japan's installations fell 19% and it surrendered the second-place market position it had held for decades. And among surveyed firms, 27.0% of Japanese companies had made no organisational effort on AI at all — an order-of-magnitude outlier among the four surveyed countries (full figures in the sections below and the appendix).
Facing the advantages the US and China are now consolidating, can Japan still hold an important place in the next round of industrial competition? Are its strengths in semiconductor materials, equipment and manufacturing enough to do it?
One clarification first — which decline we mean. This is not a story of an industry shrinking in absolute terms (equipment makers are still growing; robot production is still the world's largest). It is about relative decline: Japan still advances, but the US and China advance faster in growth, in defining technology, and in capturing value, so Japan's position shifts downward passively. Confusing the two declines is the shared error of "Japan is finished" and "Japan is still strong" narratives alike.
1 · What counts as an AI competitive position
Model counts or investment totals alone cannot judge whether a country has a position. This article asks three questions — who sets the technology, who makes the money, who can act alone — applied to all three countries:
| Question | What it asks | United States | China | Japan |
|---|---|---|---|---|
| Technology leadership | Who develops core technology, sets routes, interfaces and standards | Models, platforms, design, EDA — all in hand | Models closing in, ecosystem self-contained | Strong upstream steps, routes set by others |
| Value capture | Who takes the main new profit, holds pricing power and customer relationships | Platform and cloud rent | Scale deployment and the home market | Sells equipment and materials, furthest from the end customer |
| Strategic independence | Who can deploy autonomously, who depends heavily on others | Depends on TSMC capacity and ASML | Depends on imported chips and equipment (advanced end) | Depends on foreign models, platforms and GPUs |
The article's question compresses into one sentence: it remains important in the traditional semiconductor upstream — can that importance be converted into technology leadership, economic value and strategic independence in the AI era? Sections 2 to 5 lay out the evidence, section 6 the three futures, section 7 our judgment.
2 · The frontier gap may widen
First, read the "0" correctly. Stanford AI Index 2026 counts 2025's notable models: US 59, China 35, South Korea 8, Japan 0. In 2024 it was US 40, China 15, Japan again 0. Epoch AI's "notable" is a significance filter — leading results, wide citation or use. It has limits: it favours publicly visible work and under-covers internal corporate models and non-English ecosystems. So the accurate reading of "0" is: no Japanese model entered the global frontier tier — not that Japan develops no models. The GENIAC programme produces models; four of the Digital Agency's seven selected domestic models are trained from scratch; Rakuten released the 671B-parameter AI 3.0. They all exist. None of them is in that tier. Cumulatively over 2017–2025, Japan has 6 notable models; South Korea has 23.
The other side of the gap is the US and China converging. The performance gap between the top US and top Chinese models, on the Arena leaderboard measure, was down to 2.7% by March 2026; DeepSeek-R1 briefly matched the top in February 2025, and the lead has changed hands since. The frontier is a two-player race in which the second player is accelerating — China's notable count rose from 15 to 35 in a year.
Why this gap may reinforce itself. Frontier models have a flywheel: capital (2025 private AI investment: US $285.9bn, China $12.4bn, Japan $1.11bn) buys compute, compute produces models, models become platforms, platforms collect rent that funds the next round of capital. China also runs a second, state-capital engine (government guidance funds deployed an estimated $184bn into AI firms cumulatively over 2000–2023; a new ¥60.06bn national AI industry fund was set up in 2025). Japan is on no part of this flywheel: SoftBank's $64.6bn bought shares in OpenAI — it did not build a Japanese flywheel.
The counterexample is patents. Japan's research output is not zero: WIPO counts 3,409 generative-AI patent families for Japan over 2014–2023, fourth in the world (China 38,210, the US 6,276, South Korea 4,155). But patent families measure filing volume — China's lead on this metric is equally not a direct capability lead, and US patents carry disproportionate citation impact. What this counterexample proves is only that Japan's research system still runs — between patents and frontier models stand capital, compute and productisation.
The core question for this dimension: if a country depends on foreign models for the long term, what happens to its influence over important technology routes? The current evidence: routes, interfaces and open-source ecosystems accumulate where the models are made.
3 · What Japan still holds: six upstream steps
Before the pessimism, an inventory of Japan's strengths under the strictest standard we can apply. The admission standard is three conditions set by this publication; a step qualifies only if it is (1) unavoidable in manufacturing advanced AI chips (EUV logic + HBM + advanced packaging), (2) led by a Japanese firm with Japanese firms jointly above 50% share, and (3) without a substitute already in mass production on advanced lines. Exactly six qualify, in two groups:
Equipment — three steps
| Step | Japanese firms | Share (source · year) | Substitution progress |
|---|---|---|---|
| Coat/develop | Tokyo Electron | 86.6% (2025, The Information Network) | Kingsemi (NAURA-controlled): front-end breakthrough targeted for 2026–27, not yet in advanced-line production |
| EUV mask inspection | Lasertec | 100% (actinic inspection, sole commercial supplier) | No Chinese product or customer visible |
| Semiconductor test | Advantest | ~65% (testers overall, company estimate, 2025) | Changchuan and Huafeng tester revenue ~+55% / +46% in 2025 |
Materials — three steps
| Step | Japanese firms | Share (source · year) | Substitution progress |
|---|---|---|---|
| EUV photoresist | JSR, Tokyo Ohka, Shin-Etsu, Fujifilm | ~90% (for EUV, industry estimate; photoresist overall ~50%) | No reported Chinese EUV resist in mass production |
| Silicon wafers | Shin-Etsu, SUMCO | ~53% combined (industry estimate) | Chinese 300mm wafers in volume production (mature nodes mainly) |
| ABF film | Ajinomoto | >95% (company statement) | Second source still at the investment stage |
The same yardstick marks Japan's boundary: etch (Tokyo Electron third at ~15%, market-research estimate), deposition (Applied Materials leads), lithography (ASML at 97% of ArF immersion in 2024, Nikon ~3%), cleaning (SCREEN leads every sub-segment, but Chinese substitutes are in mass production with self-sufficiency claimed at ~50%). The industrial base is also real: 38% of global robot production (IFR), an operational stock of about 450,530 units, second in the world (end-2024).
This list is genuine. But be clear about what it does and does not show: it shows shares above half, with no substitute available today; it does not show who calls the shots. — of the six, only JSR carries a control dimension (taken private by the state-backed JIC for about ¥900bn in 2024); the rest are commercial shares. A share can be voided by one technology generation; control decides who has a say when it is.
Evidence that importance and bargaining power are decoupling is already visible in this list's largest customer. The top five Japanese equipment makers (Tokyo Electron, Advantest, SCREEN, Disco, Kokusai Electric) sold a combined ¥1.47 trillion into China in FY2025 — down roughly a tenth, the first decline on record. SCREEN's China sales were 38% of its net sales (42% the year before); Tokyo Electron's China revenue share has fallen from 44% in FY2024 to about 30%. In other words, Japan's most irreplaceable products are sold to the customer substituting fastest; the more successfully that customer localises, the thinner this list's rent becomes. A historic share peak has never proved future pricing power — Japan held about half of the global semiconductor market in 1988, and the thirty years after that are well known.
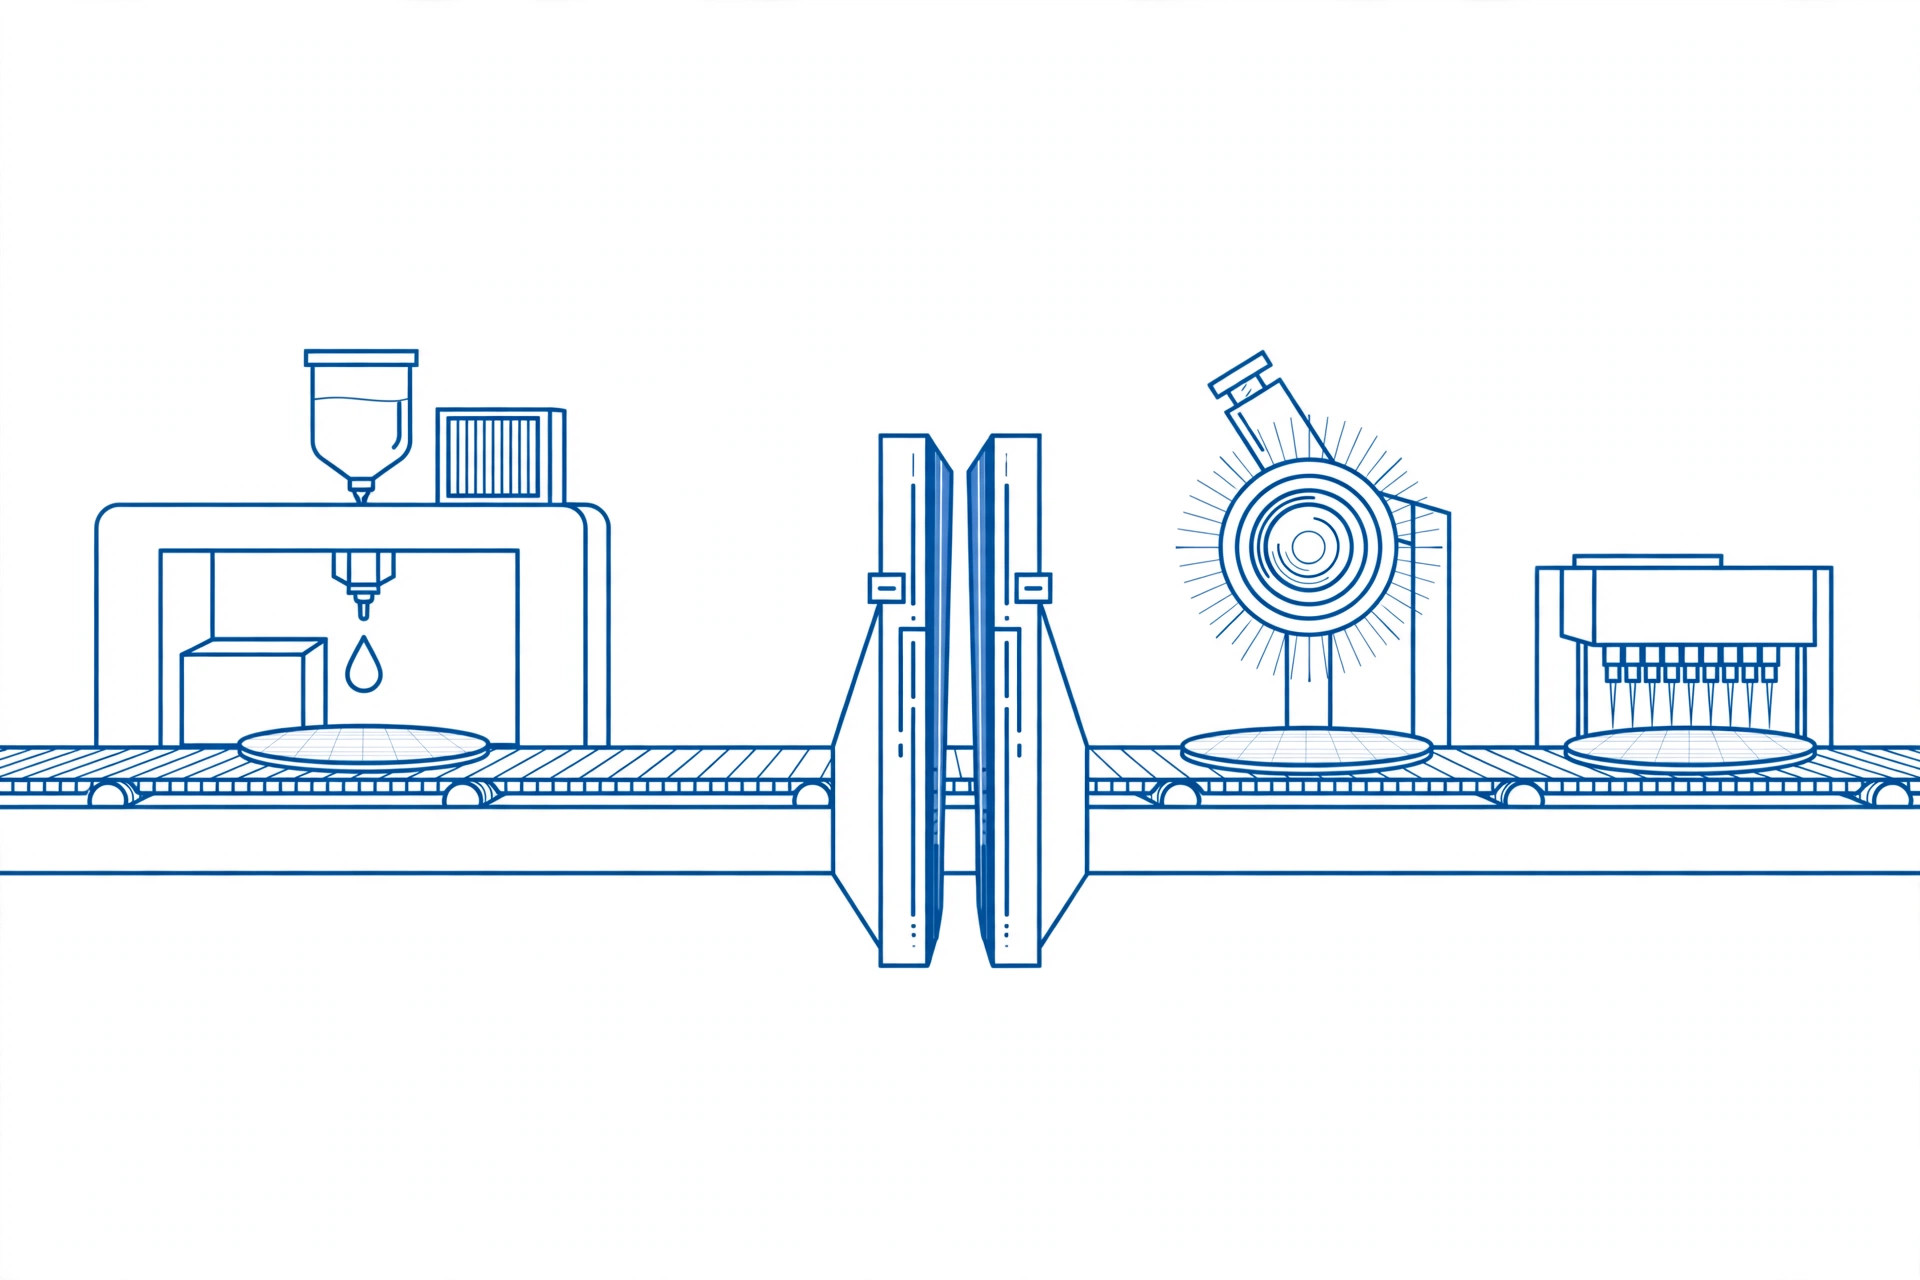
4 · The pressure: four dynamic lines
Line one: China's substitution. China's equipment self-sufficiency (CSIA data) jumped from 25% in 2024 to 35% in 2025; NAURA's 2025 revenue was ¥39.35bn (+30.9%), AMEC's ¥12.38bn (+36.6%). But the line has not reached the deepest point — advanced lithography self-sufficiency can only be described qualitatively as "approaches zero" (TrendForce); SMIC's most advanced production node is 7nm class (confirmed by TechInsights teardowns), with no EUV available; and China remains a large net IC importer (2025 imports about $424bn against exports of about $202bn). Substitution and its speed are both real — but the deepest steps have not been reached.
Line two: China's deployment — the line that challenges Japan's industrial strength head-on. IFR World Robotics 2026 (released September 2026), 2025 data:
Three details matter more than the totals. First, Japan fell out of second place: the US, at about 38,500 units (+12%), passed it, and the IFR's verdict on Japan is that demand "is expected to grow slightly, but a major recovery is unlikely in the short to medium term." Second, Chinese suppliers installed 195,000 units in their home market in 2025 — 55% of it (57% in 2024, IFR data): in the world's largest market, local vendors are now the main suppliers. Third, installation volume measures demand and deployment speed, not physical-AI capability directly — installing more does not mean smarter robots. But it decides where the training grounds are and whose ecosystem applications grow around.
So are Japan's robot makers actually losing competitiveness? The supply end is not falsified: Japanese makers still account for 38% of global robot production (2024, IFR), and FANUC's or Yaskawa's competitiveness cannot be sentenced by one year of home installations. The China-market end is where the pressure is most concrete: FANUC has lost the industrial-robot lead in China (Nikkei), and China is where about 59% of world demand sits. Conclusion: what is hit first is demand and China-market share; manufacturing capability itself is not falsified — but the direction is uniformly down. The new physical-AI round repeats the pattern: 2025 humanoid shipments — Unitree above 5,500 units (disclosed in its prospectus), AgiBot 5,168 (Omdia estimate); Tesla's Optimus at only hundreds of units, production paused mid-year for redesign; Japan has no citable shipment series at all. Once again, the "volume" appeared first in China.
Line three: America's platforms. The US advantage is not in factories but in ecosystems: models (59), platforms (cloud and agent interfaces), design (46% of chip-design revenue, 2021, SIA/BCG) and EDA (Synopsys and Cadence at 61% combined, 2024) interlock. When Japanese firms deploy AI, Mizuho's agent pilot runs on Anthropic's Claude SDK and the Digital Agency's disaster-response app sits on Claude and Amazon Nova — every layer of deployment depth pays another layer of platform rent. This line needs no "catching up" narrative; it is a completed structure.
Line four: Japan's own depreciation. The chokepoint makers' R&D cash flow is the same money as the China market (previous section); the semiconductor engineer shortage is about 40,000 people (JEITA); the home robot market is judged by the IFR unlikely to recover strongly in the medium term. Not all the pressure is external — the capital itself is depreciating.
5 · Using AI is not the same as earning from AI
On making money, Japan is the weakest of the three. The evidence is the MIC's four-country, same-questionnaire survey in the Information and Communications White Paper 2026 (Jan–Feb 2026; 477 Japanese firms, 308 each in the US, Germany and China, self-reported — shares within the sample, not all firms in each country):
| Indicator (generative AI) | China | United States | Japan |
|---|---|---|---|
| Used in at least one business function | 98.1% | 90.9% | 86.4% |
| Company-wide, cross-functional rollout | 40.9% | 35.6% | 21.5% |
| No organisational effort at all | 2.6% | 1.4% | 27.0% |
On breadth, Japan is not far behind (see the table). The gap is in depth: more than a quarter of surveyed firms "use it, with no organisational effort at all" — that 27.0% is an order-of-magnitude outlier among the four countries (Germany: 4.9%). A second domestic survey (Teikoku Databank, March 2026, 10,312 responding firms), designed differently and not directly comparable, found 34.5% of firms actively using generative AI — 47.8% in services, just 26.4% in construction: adoption varies steeply by sector and firm size.
Globally, "used but not earning" is not Japan's alone: McKinsey's 2025 survey (1,993 organisations worldwide) found 88% using AI, but only 39% reporting any EBIT impact (most under 5%). The difference is that others convert slowly while earning on platforms and models; Japan pays platform rent to others first. And the boundary: no productivity or economic loss figure can be computed from that 27% — no statistics office anywhere has yet published AI-attributed productivity data.
The deployment base is the other side of the same coin. Of the Digital Agency's seven selected domestic models, four are trained from scratch, two rest on overseas bases (one on Meta's Llama, one co-developed with Canada's Cohere), and one is undisclosed. The pattern: the bigger the model, the more borrowed the base — Rakuten AI 3.0 (671B) publicly ships a config file declaring a DeepSeek-V3-class architecture (community analysis; the company has not confirmed it). The state is manufacturing demand by procurement (paid contracts from April 2027), and the 44-company Noetra consortium targets a 27,500-GPU cluster running by June 2028. The demand and the field are Japan's; the GPUs and platforms are not.
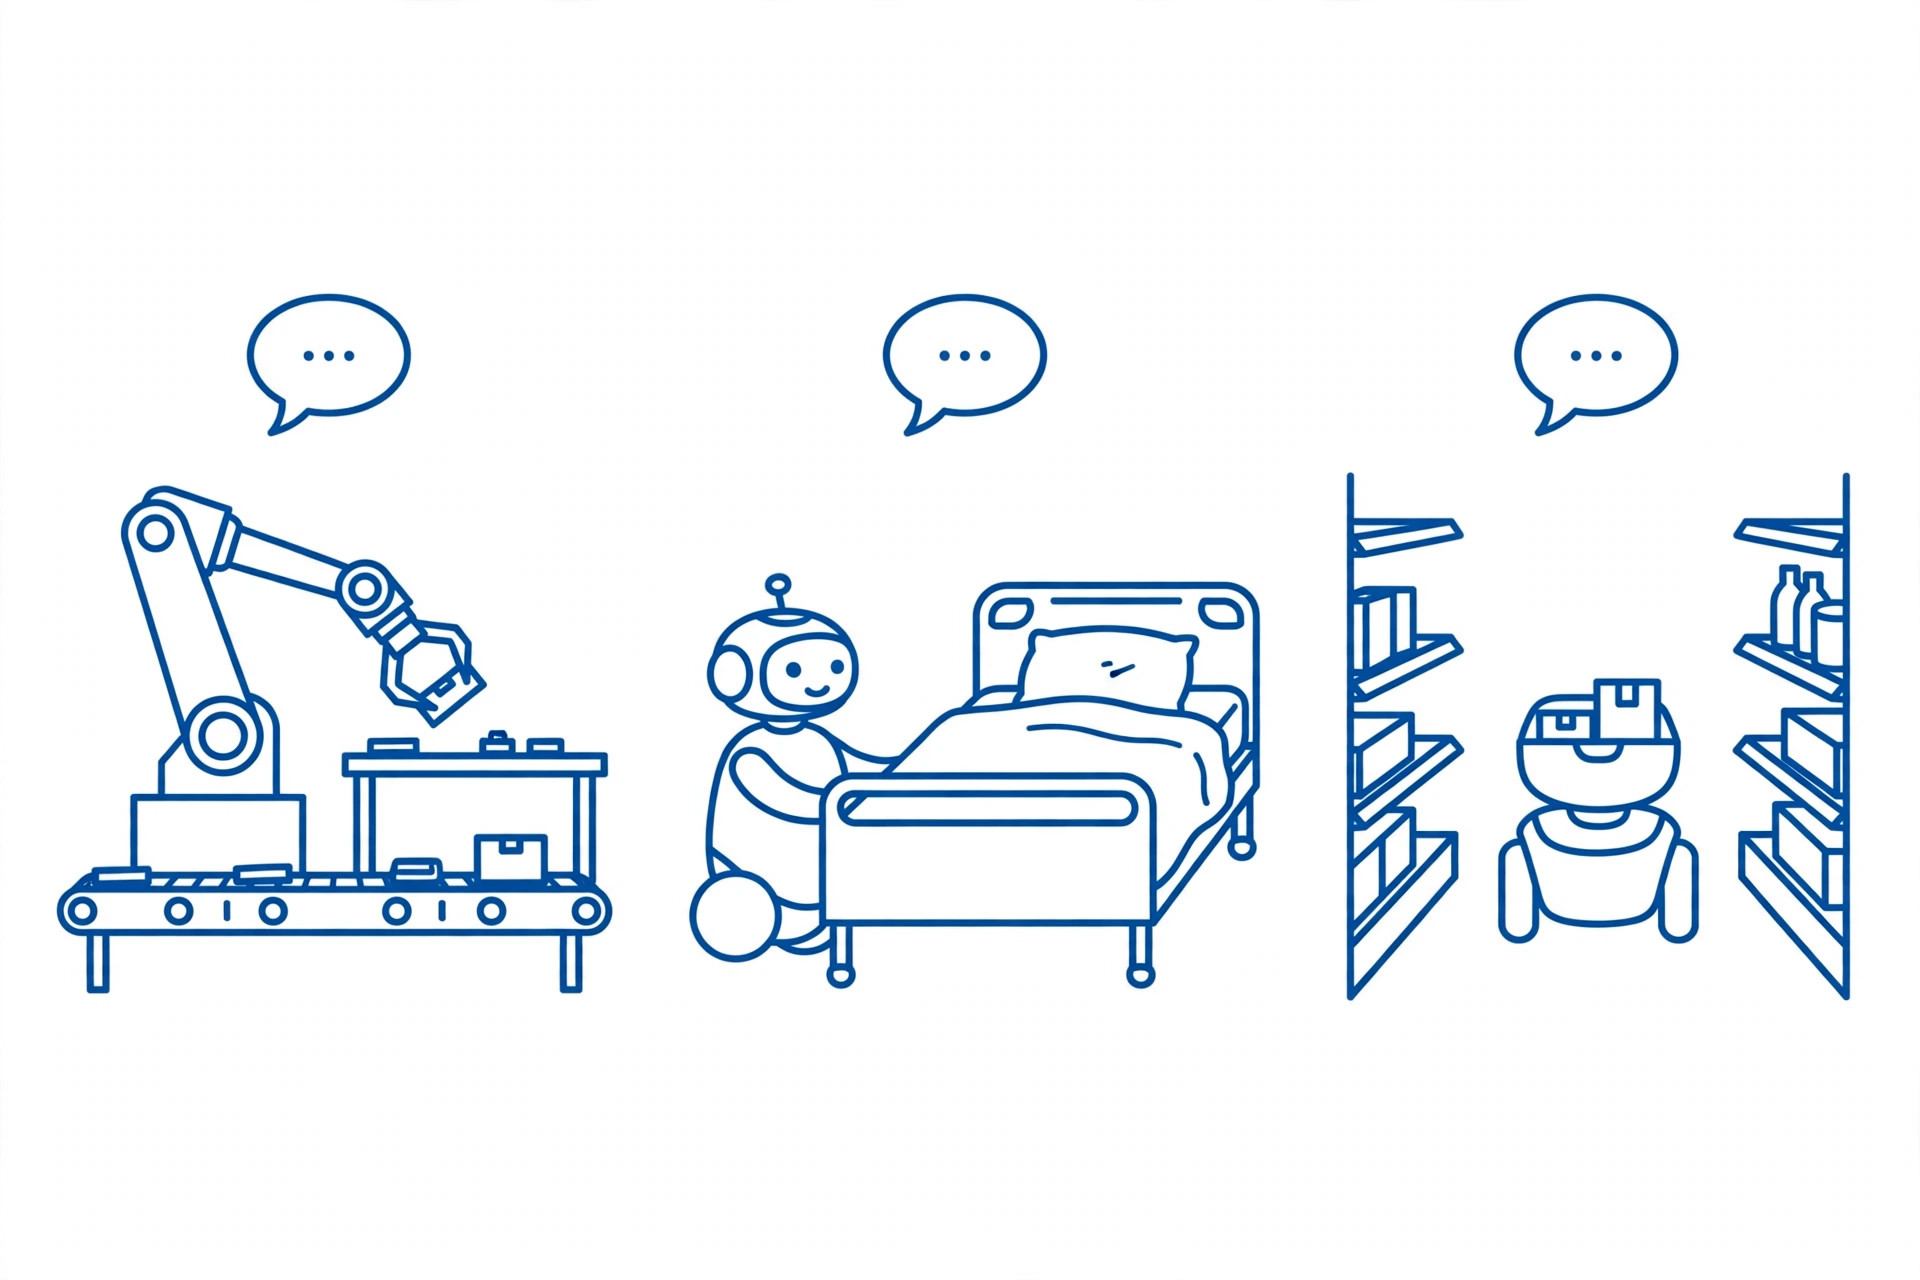
6 · Three futures — which one arrives?
Scenario A: the high-value supplier (the default drift). The six upstream steps broadly hold; equipment and materials keep generating solid revenue and profit; but models, platforms, standards and end-customer relationships belong to others, and Japan is absent from every round of technology agenda-setting.
- Why we say it: the six steps' current irreplaceability, and the equipment and robot makers' existing profitability (inventoried above).
- The hardest part: the speed of substitution (China's self-sufficiency +10 points a year) and bottleneck migration — the list is a product of the previous generation's bottlenecks.
- Signals to watch: by end-2028, re-run the same yardstick — are all six steps still on the list? Do Japanese equipment makers' China sales stop falling?
- What would overturn it: a Chinese supplier entering mass production on a non-Chinese advanced line in any step (A degrades into C), or a Japanese firm taking the lead in a new bottleneck category such as advanced packaging or HBM-related steps (A upgrades).
Scenario B: home ground in niches of physical AI. On the strength of robot stock, field data, rigid care demand and social acceptance (public support of 72.4% for AI-assisted diagnosis and 73.7% for care robots, MHLW survey), Japan grows a competitive application ecosystem in industrial and care settings — moving from deployment tenant to home-side player in niches.
- Why we say it: stock and production share, state procurement and Noetra, social acceptance (see sections 4 and 5).
- The hardest part: the base is still rented (GPUs, foundation models); China's speed on robot hardware and cost (humanoid shipments already at scale); a shrinking home installation market.
- Signals to watch: the April 2027 paid procurement happens on schedule and unshrunk; the Noetra cluster runs by June 2028; Japanese robot installations stop falling.
- What would overturn it: the procurement falls through, the cluster slips, or Chinese vendors take a landmark share of Japan's own physical-AI settings — any one of these demotes B to a slogan.
Scenario C: continued relative decline. The upstream is eroded step by step, the application ecosystem depends further on foreign platforms and models, and Japan retreats on all three dimensions at once — the industry remains, the revenue remains, but "indispensable" expires item by item.
- Why we say it: all four dynamic lines point the same way (models, substitution, deployment, organisational conversion — see sections 4 and 5).
- The hardest part (for scenario C): the depth of Japan's stock and the state's demonstrated will — the JSR trusteeship and the ¥10 trillion framework show Tokyo defending seriously; Chinese substitution has not yet breached the deepest steps (lithography, EUV materials).
- Signals to watch: any of the six steps with Japanese firms jointly below 50%; Chinese coat/develop equipment above 25% of installations in China's new advanced fabs (CSIA/TrendForce data); Japan's notable-model count still zero with the US–China gap intact.
- What would overturn it: a Japanese model entering the frontier tier, Rapidus reaching mass production with a named major customer, or the chokepoint list expanding at a new bottleneck — any one forces C's premise to be re-estimated.
We assign no probabilities. Only this: A has the thickest evidence, B the highest ceiling, C the densest direction signals.
7 · Judgment: the unanswered question
The four tests point to one provisional judgment — absent from the frontier in technology, furthest from pricing power in money, upstream in its own hands and the base in others' in independence:
Japan has not lost all its chips in the AI contest, but its historic manufacturing strengths do not guarantee its place in the next generation. The risk that, relative to the US and China, Japan gradually becomes a high-value supplier rather than a core rule-setter deserves to be taken seriously.
This is not a prophecy. The evidence that would change it is concrete: the April 2027 paid procurement, Rapidus mass production in the second half of FY2027, the Noetra cluster in June 2028, and the end-2028 re-run of the chokepoint list. If two of the four arrive better than expected, we will revise the pessimism down; if they fail together, even Scenario A — the high-value supplier — will need rewriting. Facts before judgment; judgment waits for facts.
And the question, left with you, the reader:
Japan may keep making the materials, equipment and robots the world cannot do without. But if models, platforms and the next round of industry rules are increasingly decided by other countries, then — is an indispensable supplier the same thing as an influential competitor?
Over the next ten years, is Japan participating in the creation of AI-era value — or gradually losing the ability to decide how that value is divided?
Appendix: key data across the three countries
| Area | Indicator | United States | China | Japan | Source · year |
|---|---|---|---|---|---|
| Technology leadership | Notable AI models | 59 | 35 | 0 | Epoch classification, 2025 (AI Index 2026) |
| Technology leadership | Generative-AI patent families | 6,276 | 38,210 | 3,409 (4th) | WIPO, 2014–2023 cumulative |
| Technology leadership | Chip-design revenue share | 46% | — | — | SIA/BCG, 2021 |
| Value capture | Private AI investment | $285.9bn | $12.4bn | $1.11bn | Quid data, 2025 (AI Index 2026) |
| Value capture | Semiconductor equipment market (buyers) | North America $10.9bn | $49.3bn (#1) | $9.5bn | SEMI, 2025 actuals |
| Chip manufacturing | Foundry share | — (TSMC 69.9%) | SMIC 5.3% (#3) | Zero domestic production | TrendForce, 2025 |
| Upstream steps | Six unavoidable steps led | Equipment ranked #2, #3 | Self-sufficiency 35% | Leads all six steps | This publication's yardstick, 2025 |
| Industrial deployment · 2025 | Robot installations | ~38,500 | 354,000 (~59%) | 36,219 (−19%, #3) | IFR WR2026, 2025 |
| Industrial deployment · 2025 | Robot operational stock | 393,700 | 2,027,190 | 450,530 (#2) | IFR WR2025, end-2024 |
| Industrial deployment · 2025 | Robot production share | Hardware mostly imported | Domestic brands 55% of home installations (2025) | 38% (world #1) | IFR, 2024–2025 |
| Commercialisation · early-2026 survey | Company-wide AI rollouts | 35.6% | 40.9% | 21.5% | MIC four-country survey, Jan–Feb 2026 |
| Commercialisation · early-2026 survey | No organisational effort | 1.4% | 2.6% | 27.0% | Same survey |
| Strategic independence | Advanced capacity ownership | Depends on TSMC | No EUV | Depends on foreign capacity and GPUs | Qualitative, 2025–2026 |

Sources & references
- Stanford Institute for Human-Centered AI, AI Index 2026 (notable models 2025: US 59 / China 35 / South Korea 8; top-model Arena gap 2.7%, March 2026; 2025 private AI investment, Quid data) and AI Index 2025 (2024 model counts and benchmark gaps) https://aiindex.stanford.edu/report/
- WIPO, Patent Landscape Report: Generative AI (July 2024): patent families — China 38,210 / US 6,276 / South Korea 4,155 / Japan 3,409 (2014–2023, by inventor location) https://www.wipo.int/pressroom/en/articles/2024/article_0009.html
- OECD, AI Papers No.47 (2025): experimental estimates of AI R&D investment (2023: US €89.8bn / Japan €10.5bn); SoftBank Group (1 Oct 2026: cumulative investment in OpenAI of $64.6bn) https://group.softbank/en/news/press/20261001
- SEMI, WWSEMS (April 2026): 2025 global equipment billings of $135.1bn — China $49.3bn, Taiwan $31.5bn, South Korea $25.8bn, North America $10.9bn, Japan $9.5bn https://www.semi.org/en/SEMI-Reports-Global-Semiconductor-Equipment-Billings-Reached-135-Billion-in-2025
- TrendForce (2025 foundry shares: TSMC 69.9% / Samsung 7.2% / SMIC 5.3%; 2024 EDA: Synopsys 31% / Cadence 30% / Siemens EDA 13%); SIA/BCG (US chip-design revenue share 46%, 2021); TechInsights (SMIC 7nm-class N+2 teardown)
- The Information Network (coat/develop 86.6%, 2025); Lasertec (sole supplier of EUV mask actinic inspection); Ajinomoto (ABF share "above 95%"); SCREEN Group profile (cleaning sub-segment shares; China at 38% of net sales, FY2026/03); top five Japanese equipment makers' China sales of about ¥1.47 trillion, first decline (Nikkei, via TrendForce)
- CSIA equipment self-sufficiency (via TrendForce, January 2026: 25% → 35%); NAURA and AMEC 2025 annual reports (revenue ¥39.35bn / ¥12.38bn); Kingsemi earnings briefing (October 2026); General Administration of Customs (China IC trade 2025: imports about $424bn, exports about $202bn, via SCMP/CEIC)
- International Federation of Robotics, World Robotics 2026 press release (24 Sep 2026): 2025 installations — China 354,000 (~59%), United States about 38,500, Japan 36,219 (−19%, third), South Korea 30,000; Chinese suppliers at 55% of home installations (195,000 units); global stock of 5 million units https://ifr.org/ifr-press-releases/news/five-million-robots-now-operate-in-factories-globally ; stock and density from World Robotics 2025 (2024 data: Japan stock 450,530, density 446 per 10,000 employees; Japan at 38% of global robot production)
- Ministry of Internal Affairs and Communications, Information and Communications White Paper 2026, four-country comparative survey (Jan–Feb 2026; Japan n=477, US/Germany/China n=308 each): generative-AI usage, company-wide rollouts, no organisational effort, individual usage https://www.soumu.go.jp/johotsusintokei/whitepaper/eng/WP2026_overview.pdf
- Teikoku Databank, survey on corporate generative-AI trends (March 2026, 10,312 valid responses): 34.5% of firms using generative AI, from 47.8% in services to 26.4% in construction (different definition and sample from source 9; not directly comparable)
- McKinsey, The State of AI 2025 (November 2025, n=1,993): 88% of organisations use AI; 39% report EBIT impact (mostly under 5%)
- Digital Agency (Gennai trial and domestic model selection, 6 March 2026) https://www.digital.go.jp/news/10d55c63-b3e1-42b9-9cc5-93a06943ae0e ; NEC (Noetra launch, 16 July 2026) https://www.nec.com/en/press/202607/global_20260716_01.html ; Ministry of Health, Labour and Welfare (care workforce supply-demand estimates and AI attitudes survey, 2026)
- Jiji Press and others (15 Oct 2026): third round of the Japan–US investment framework (GlobalFoundries' two New York fabs, Japanese funding capped at $21bn); METI (cumulative support for Rapidus of ¥2.354 trillion, April 2026; JIC's privatisation of JSR, 2024); Omdia (2025 humanoid shipment estimates: AgiBot 5,168 units); Unitree prospectus (2025 humanoid shipments above 5,500 units)
Spotted an error or something out of date? Let us know via the contact page. Corrections are reflected in the updated date.
Original research and analysis by JNoted. Please cite with a link; full republication or commercial use requires prior permission.