Pages · 1/8
Five years, 3.17 million fewer people
On October 1, 2025, Japan had 122.97 million people — 3,173,571 fewer than five years earlier (−2.5%). The census has now fallen three times in a row, the first such run since it began in 1920.
But this article is not really about shrinking. It is about where those 3.17 million disappeared from — and who, meanwhile, is growing.
Pages · 2/8
Only one place grew
Of 47 prefectures, only Tokyo grew. Saitama, Chiba, Kanagawa, Aichi, Shiga, Fukuoka and Okinawa — all growing last time — all shrank this time.
The four capital prefectures together added only 61,000 people (Tokyo alone +189,000) — yet their share rose, because the country lost 3.17 million. Concentration does not mean Tokyo is rising fast. It means everyone else is falling faster.
Pages · 3/8
The decline is not one story
−4.267m
Japanese nationals, five-year change
+1.094m
Foreign residents, five-year change
−3.174m
Total population, five-year change
The counts add up exactly: Japanese nationals −4,266,973; foreign residents +1,093,525; nationality not stated −123; total −3,173,571. About 96% of the Japanese decline (4.11 million) was natural decrease — fewer births than deaths. People are not leaving. They are not being born.
Pages · 4/8
Tokyo's paradox
Two sides of the paradox
The fewest births — a fertility rate of 0.96, the lowest in Japan.
The biggest inflow — net in-migration of 65,000 in 2025, No. 1 in Japan; a population of 14.24 million, also No. 1.
Tokyo was not born. It was moved into. And Tokyo itself is slowing: its growth narrowed from +3.9% at the last census to +1.3%. It is not booming. It is sinking slowest.
Pages · 5/8
Houses outlast people
People fell by 3.17 million, yet households rose by 1.47 million to 57.18 million. Single-person households are 41.4% (38.0% in 2020); people 65 and over are 29.4%. Families are getting smaller and the country older — the new households are in the cities, the empty houses in the regions.
Pages · 6/8
Why this is happening
2.01
Children couples plan to have (unchanged in a decade)
29.9%
Men never married at 50 (a record high)
-20%
Births over five years: 841,000 (2020) → 671,000 (2025)
What couples want has not changed; marriage has. Child policy subsidises life after marriage — the leak is before it. And one force is pure arithmetic: the pool of mothers is itself shrinking — births have fallen 20% in five years and will keep falling for years whatever intentions do. The foreign line is a structural swap too: Vietnamese +226,000 in five years through work channels, Koreans −36,000 as the old settler generation passes, and Chinese +141,000 — still the largest stock, but a settled one growing slowly while its share falls.
Pages · 7/8
The judgment card
Will concentration stop on its own? Tokyo's growth has already narrowed to +1.3% — sinking slowest, but still sinking. Watch one number first: the capital region's share, now 30.1%. The 2030 census will answer.
Pages · 8/8
Japan is not shrinking. It is concentrating. In five years the country lost 3.17 million people, but growth happened in Tokyo alone, and the four capital prefectures' share of the national population rose from 29.3% to 30.1%. Japanese nationals fell by about 4.27 million while foreign residents rose by about 1.09 million — without the latter, the shrinkage would be much deeper; without the flow of people into Tokyo, there would be no single exception.
Japan had 122.97 million people on Oct 1, 2025, down 3.17 million in five years. Japanese nationals fell about 4.27m while foreign residents rose 1.09m to 3.84m; Tokyo was the only prefecture to grow. Japan is not just shrinking — it is concentrating.
Key takeaways
- Total population 122.97 million, down 3.17 million (−2.5%) in five years — the census's third consecutive decline.
- The four capital prefectures added only 61,000 people between them, yet their share of the nation rose from 29.3% to 30.1%; Tokyo's growth rate narrowed from +3.9% to +1.3%.
- Only Tokyo grew among 47 prefectures; the seven prefectures that grew last time all flipped to decline.
- Japanese nationals fell about 4.27 million, some 96% of it natural decrease (births of 3.67 million against deaths of 7.78 million in 2021–2025); foreign residents rose 1.09 million to 3.84 million (+39.8%), a record — and one in five of them lives in Tokyo. The largest gain was Vietnamese (+226,000); Koreans were the only major nationality to shrink (−36,000).
- Births in 2025 were 671,270 (Japanese nationals), the lowest since 1899; the total fertility rate was 1.14, Tokyo 0.96. The share never married at age 50 hit record highs: 29.9% of men, 19.6% of women.
- Households rose by 1.47 million to 57.18 million, with single-person households at 41.4%; people aged 65 and older are 29.4% — shrinkage, concentration and aging at once.
Japan is not shrinking. It is concentrating. In five years the country lost 3.17 million people, but growth happened in Tokyo alone, and the four capital prefectures' share of the national population rose from 29.3% to 30.1%. Japanese nationals fell by about 4.27 million while foreign residents rose by about 1.09 million — without the latter, the shrinkage would be much deeper; without the flow of people into Tokyo, there would be no single exception.
First, the cast
Tokyo — the only prefecture of 47 that grew, up 189,000 in five years (+1.3%, after +3.9% in the previous census), with a total fertility rate of 0.96, among the lowest in Japan.
The other 46 prefectures — all shrank, including seven that grew last time and flipped to decline this time. The largest fall was Hokkaido's, at 244,000 people; the fastest was Akita's, at −8.1%.
Japanese nationals — down about 4.27 million (−3.5%) in five years, after a −1.4% fall in the previous census.
Foreign residents — up 1.09 million (+39.8%) to 3.84 million, a record. Chinese nationals are 24% of them, Vietnamese 15.9%.
People are not declining in the abstract. They are moving from the rest of Japan to Tokyo, and from abroad into Japan. Here are the numbers.
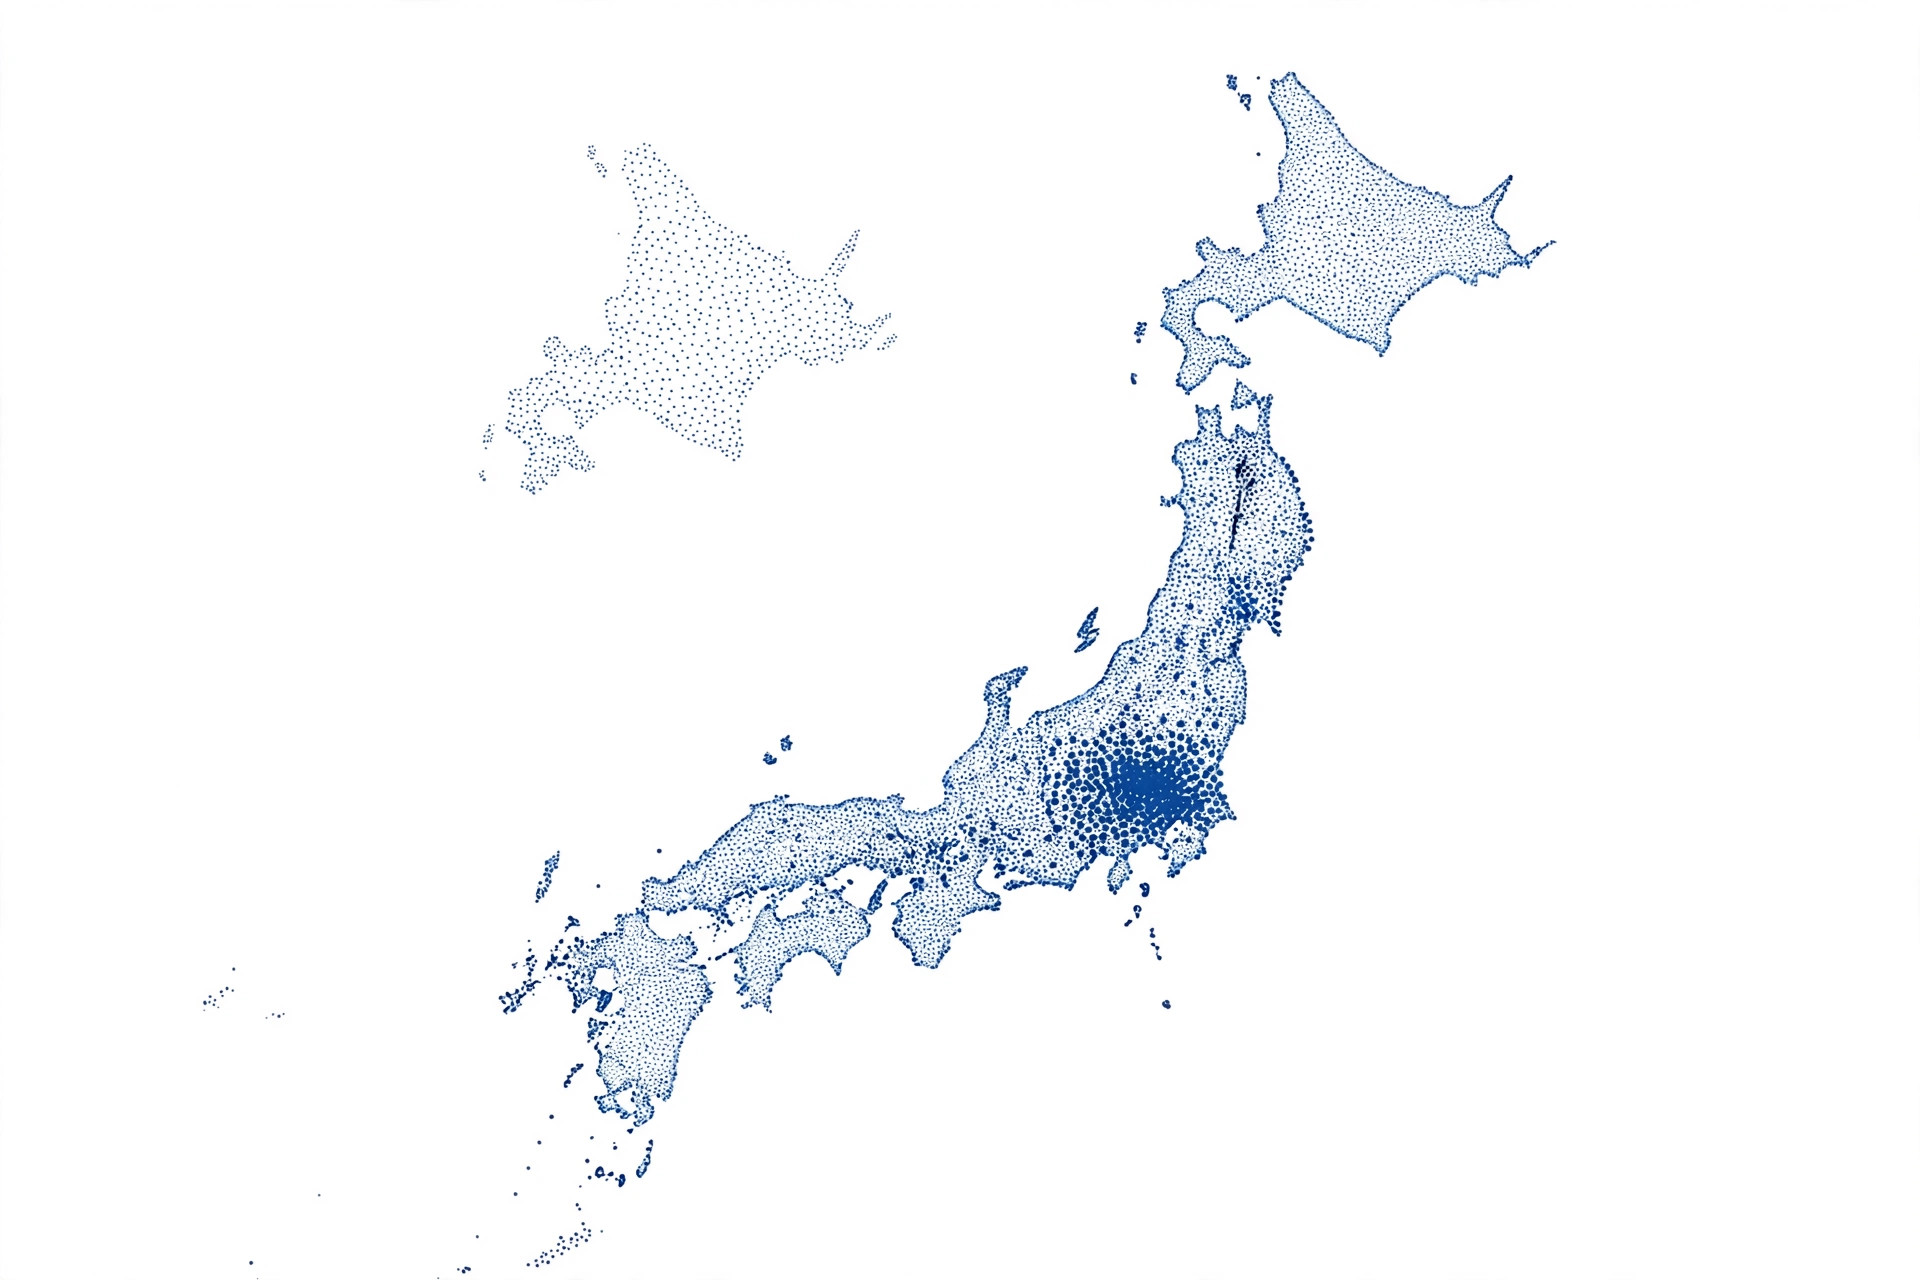
1. The total: 3.17 million fewer in five years
What this chart shows: 3.17 million fewer people in five years, a 2.5% fall. The 2020 figure is the readjusted comparison base.
Fact
Statistics Bureau of Japan, Basic Complete Tabulation on Population and Households of the 2025 Population Census (survey date October 1, 2025; released September 29, 2026): total population 122.97 million, down 3.17 million (−2.5%) from 2020 — the third consecutive decline since the census began in 1920. Note also: the preliminary count released May 29, 2026 was 123.05 million, so the final tabulation came in about 77,000 lower — even the first count was optimistic.
Look at the two ends of the map. At one end, Tokyo alone grew, by 189,000 — but its growth rate narrowed from +3.9% in the previous census to +1.3%. At the other, Hokkaido lost 244,000 people, the largest absolute fall, and Akita shrank fastest, at −8.1%. The four capital prefectures — Tokyo, Saitama, Chiba and Kanagawa — together hold 36,975,099 people, just 61,000 more than five years ago, yet their share of the nation rose from 29.3% to 30.1%. That is the measurable meaning of "concentration": not that Tokyo rose, but that everywhere else fell faster.
"Fewer babies" is not wrong, but it is too coarse. Inside that 3.17 million total, two forces point in opposite directions.
2. The decline is not one story
What these charts show: Japanese nationals fell by about 4.27 million in five years; foreign residents rose by about 1.09 million. Only after netting the two do you get −3.17 million.
Fact
From the same tabulation: Japanese nationals about 119.13 million, down about 4.27 million (−3.5%), after a −1.4% fall in the previous census. Foreign residents 3.84 million, up 1.09 million (+39.8%), a record. Among foreign residents, Chinese nationals are 24%, Vietnamese 15.9%, and South and North Koreans 10.4%. In 2020, South and North Koreans (15.8%) still ranked ahead of Vietnamese (13.9%).
The 4.27 million can be opened into a ledger. From the final vital statistics: across 2021–2025, Japanese births totalled 3.67 million and deaths 7.78 million — a natural decrease of 4.11 million, about 96% of the entire fall in Japanese nationals. The remaining roughly 150,000 is a residual: net outflow, the timing gap between calendar-year vital statistics and the October 1 census, and counting error combined. In short, the Japanese population is shrinking almost entirely because fewer people are born than die — not because people are leaving Japan.
Our reading
Without the 1.09 million rise in foreign residents, the five-year decline would have been 4.27 million, not 3.17 million — roughly a quarter of the shrinkage was offset. But handle that sentence with care: what was offset is the national total, not every place. Look at where foreign residents actually live in 2025: 784,000 in Tokyo alone — one in five — 339,000 in Aichi and 322,000 in Osaka, with the top five prefectures holding 52.6% of the total. They settle in big cities and manufacturing prefectures, not where the decline is worst. The offset happened in the national total, not in the places.
One number that is easy to confuse: the Immigration Services Agency's registered foreign resident count (about 3.96 million at the end of June 2025) is counted differently — a registration count, not an October 1 usual-residence count. This article uses census figures for foreign residents throughout and does not compare the two series as a rise or fall.
3. Tokyo's paradox: the lowest fertility, the only growth

Fact
Ministry of Health, Labour and Welfare, Final Vital Statistics 2025 (released September 30, 2026; Japanese nationals): births 671,270, the lowest since records began in 1899 and the tenth consecutive annual fall; deaths 1,589,533; natural decrease 918,263, the 19th consecutive year; total fertility rate 1.14, a record low, and 0.96 in Tokyo. Marriages 489,158, up for a second consecutive year — marriages recovered, births have not yet.
Our reading
The place with the lowest fertility in the country is growing. That gap can only be migration. The census counts where people slept on the night of October 1: students and workers who came to Tokyo count in Tokyo, not in their hometowns. So part of Tokyo's growth is "living in Tokyo," not "belonging to Tokyo" — but that is precisely how concentration works. People live somewhere first, and only later stay.
4. Families shrink, the population ages

57.18m
Households (ordinary households; 55.70m in 2020)
23.69m
Single-person households (41.4%; 38.0% in 2020)
29.4%
Aged 65 and older (28.5% in 2020)
21.17m
Aged 75 and older (+2.60m in five years, +14.0%)
Fact
From the same tabulation: 57.18 million ordinary households, up 1.47 million (+2.7%) from 55.70 million in 2020, averaging 2.10 people (2.21 in 2020); single-person households number 23.69 million, 41.4% of the total. Yamagata has the largest households at 2.41 people, Tokyo the smallest at 1.85. People aged 65 and older are 29.4% of the population (28.5% in 2020). Separately, the Statistics Bureau's 2023 Housing and Land Survey counts 9.00 million vacant homes, a vacancy rate of 13.8% — both record highs — including 3.86 million homes that are neither for rent, nor for sale, nor second homes.
Our reading
Population down, households up: the unit of demand for services is the household, not the person. Solo and elderly-solo households are still rising, so demand for home care, deliveries and check-ins will not fall in step with population. Vacant homes split the same way — the new households are in the cities, the empty houses in the regions. For local budgets, that is the more direct pressure than the headline total: fewer people pay tax; the number needing home visits has not fallen.
5. The counter-case: the census counts where you sleep, not where you belong
Test this article's claim against its other side. Three points shrink the size of "concentration," though not its direction.
First, the 2020 base year was a pandemic year, when foreign inflows froze. Part of the +39.8% is a rebound, not steady growth.
Second, as noted above, the census counts by place of residence. Students and short-term workers inflate Tokyo's figure, and their hometowns have not "lost" them for life.
Third, the preliminary and final counts differ by 77,000 people. Counting itself has a margin of error, so any concentration figure precise to a decimal place is false precision.
Fourth — and this cuts hardest against this article — Tokyo itself is slowing: its growth rate narrowed from +3.9% to +1.3%. If Tokyo's pull has already peaked, concentration may have passed its fastest phase.
Our reading
But those four points discount the size and the speed, not the direction. The direction is anchored by two facts no margin of error can explain away: only one of 47 prefectures grew — and, while the country lost 3.17 million people, the capital region's share rose from 29.3% to 30.1%. An error can explain tens of thousands of people. It cannot explain a rising share.
6. One layer down: why this is happening
The first five sections were about what is happening. This one asks why: why the decline resists policy, why people crowd into the capital region, and why these nationalities are rising while those are falling.
First, why child policy is not stopping the decline.
Fact
National Institute of Population and Social Security Research, 16th Japanese National Fertility Survey (2021): couples end with 1.90 children on average (the "completed" number), down slowly from about 2.2 over decades; couples' intended number of children averages 2.01, unchanged from the 2015 survey. The top reason plans fall short is economic — "raising and educating children costs too much," at 52.6%. Then the marriage gate: in the 2025 census, the share never married at age 50 reached record highs of 29.9% for men and 19.6% for women (28.3% and 17.8% in 2020). And the pool of potential mothers is itself shrinking: in 2025, women aged 25–39 numbered just 9.56 million. The result is already in the births: 840,835 in 2020 and 671,270 in 2025 — down 20% in five years, while intentions barely moved.
Our reading
Three forces stack up. First, Japan's low fertility is mainly a marriage story: married couples' intended family size has barely moved, but fewer people marry, they marry later, and late marriage erodes the plan in practice. Second, child policy subsidises the years after marriage — child allowances and more nursery places lighten the load on households that already exist — while the fastest leak is before marriage, where that money does not reach. Third, momentum: the generation of mothers is smaller to begin with, so births would keep falling for years even if fertility rebounded tomorrow. The first two are social problems. The third is arithmetic.
Next, why people crowd into the capital region.
Fact
Statistics Bureau, Internal Migration in Japan Derived from the Basic Resident Registers (2025 results, released February 2026): Tokyo's net in-migration was 65,219 in 2025, down from 79,285 in 2024 — the pull is already easing. Only seven prefectures were net-positive, and the four capital prefectures together gained 123,534: Saitama +22,427, Kanagawa +28,052, Chiba +7,836 all pulled people in. One detail is easy to misread: in 2025, foreign residents net-moved OUT of Tokyo (−378), and within the region they moved from Tokyo toward the neighbouring prefectures (−5,524 net). The crowding into the centre is now a Japanese flow; foreign residents are starting to suburbanise inside the region.
School and the first job are in Tokyo; after that, daily life, partners and the next job are in Tokyo too — migration reinforces itself. Chiba, Saitama and Kanagawa are net-positive because they are both Tokyo's dormitories and its spillover: people move into the region first, then toward the centre.
Finally, the foreign residents: who rose, who fell.
From the census, by nationality (2025 final tabulation):
| Nationality | 2020 | 2025 | Five-year change |
|---|---|---|---|
| China | 782,000 | 923,000 | +141,000 |
| Vietnam | 383,000 | 609,000 | +226,000 |
| Korea | 435,000 | 398,000 | −36,000 |
| Philippines | 260,000 | 333,000 | +74,000 |
| Nepal | 85,000 | 268,000 | +184,000 |
| Indonesia | 56,000 | 226,000 | +170,000 |
| Brazil | 195,000 | 196,000 | +400 |
| Myanmar | 29,000 | 163,000 | +135,000 |
Of the eight major nationalities, the five largest gains are Vietnam, Nepal, Indonesia, China and Myanmar. Only Koreans shrank.
Our reading
The risers came through work channels. The Specified Skilled Worker status, created in 2019, plus the older Technical Intern programme together held about 900,000 people in June 2026 (Immigration Services Agency figures), with Vietnamese the largest group — matching the census, where Vietnam gained most. Myanmar's surge also has the post-2021-coup exodus behind it.
China deserves a separate word. Its stock, 923,000, is still the largest, and it added 141,000 in five years — yet its share fell from 28.5% to 24.0%, not because fewer came, but because others came faster. It is the most settled of the major stocks: students, workers, families and permanent residents layered over thirty years. The recent growth pairs a post-pandemic return of students and workers with a push from home — competition for jobs and university places in China, and a weaker yen that made Japan relatively cheaper to reach. The newly tightened Business Manager route was used most heavily by Chinese nationals; its effects will show up in this group first. The fallers tell the opposite story: the Korean population rests on Special Permanent Residents and their descendants, a group shrinking by roughly 9,000 a year through aging (residence statistics, 2025–2026) — the same order of magnitude as the census's average Korean decline of about 7,000 a year, though the two series count differently and cannot simply be subtracted. The older generation is passing, and younger Koreans are not arriving in numbers that replace it. Brazil barely moved: its community in Japan is aging too, with arrivals and departures in balance.
7. Our judgment: concentration will not stop on its own
Our reading
First, be precise about what "concentration" means here. It is not Tokyo booming. Tokyo's growth rate has narrowed from +3.9% to +1.3%, and the four capital prefectures added just 61,000 people in five years. Concentration is a statement about shares: while the country lost 3.17 million, the capital's share rose from 29.3% to 30.1%. Tokyo is not rising. It is sinking slowest.
What each side wants currently points the same way. The government talks about regional revitalization, but companies put headquarters, universities put campuses, and young people put their first jobs in Tokyo. Nor will foreign residents refill the regions: more than half of them live in five prefectures — big cities and manufacturing giants, not the places emptying fastest. Our judgment: unless the distribution of jobs and universities changes, concentration will not reverse. With natural decrease running near 900,000 a year, population policy can change how fast each prefecture shrinks relative to the others, not the direction of concentration. A fertility rate of 1.14 will not save empty houses in the regions. Only jobs that give young people a reason to stay will.
What to watch next: the capital region's share in the Statistics Bureau's annual October 1 population estimates, and the next census in 2030.
Our reading
The falsification condition, stated up front: if the 2030 census shows the Tokyo metropolitan share falling and five or more prefectures returning to growth, this article's "concentration" judgment is wrong. Until then, look at where people are moving before asking whether the population is up or down.
Sources & references
- Statistics Bureau of Japan, Basic Complete Tabulation on Population and Households, 2025 Population Census (survey date October 1, 2025; released September 29, 2026)
- Statistics Bureau of Japan, Preliminary Counts of the 2025 Population Census (released May 29, 2026; municipality counts and preliminary total)
- Ministry of Health, Labour and Welfare, Final Vital Statistics 2025 (released September 30, 2026; Japanese nationals)
- Statistics Bureau of Japan, 2023 Housing and Land Survey (released September 25, 2024; vacant homes and vacancy rate)
- National Institute of Population and Social Security Research, 16th Japanese National Fertility Survey (2021; couples' children and why plans fall short)
- Statistics Bureau of Japan, Internal Migration in Japan Derived from the Basic Resident Registers, 2025 results (released February 2026; net migration)
- Immigration Services Agency, Statistics on Foreign Residents (end of June 2025; definitional note only)
- The Japan Times report on the Statistics Bureau release (September 29, 2026; cross-check) https://www.japantimes.co.jp/news/2026/09/29/japan/society/japan-population-fall/
Spotted an error or something out of date? Let us know via the contact page. Corrections are reflected in the updated date.
Original research and analysis by JNoted. Please cite with a link; full republication or commercial use requires prior permission.