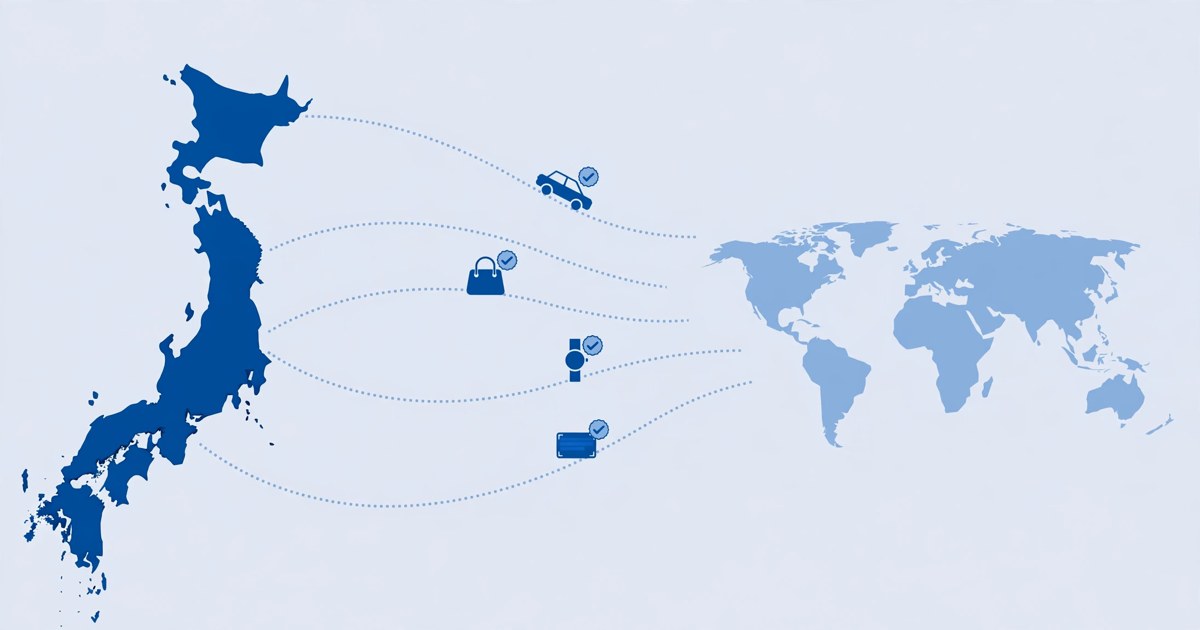
Will Japan's Carmakers Become the Next White Goods?
One quarter of being overtaken in Europe is only a signal. The real question is what happens to sixty years of accumulated advantage when the scoreboard changes from building well to learning fast. Four business models — Tesla, Toyota, BYD and Waymo — and the evidence, tested claim by claim.
Pages · 1/7
Europe's overtake: an event, and the boundary of the statistic
The leaders are not pure EVs but hybrids, which carry no extra EU tariff; September also pulled shipments forward ahead of an export cap. Registrations are not profit either: about two-thirds of European registrations run through commercial channels priced on residual values, and Europe was never the Japanese makers' profit centre. But the five-year curve holds no water: registrations rose from roughly 50,000 to roughly 700,000 (JATO). This page's conclusion is deliberately narrow: the overtake is real — it is a signal, not a verdict.
Pages · 2/7
Not just Europe: halved in China, ground lost in Thailand, held in North America
Europe was never where Japanese carmakers made their money. The weight sits in three markets — China, Southeast Asia and North America. The first two are slipping; the third is still held.
In the world's largest car market, Japanese share halved in five years. Thailand was the backyard: 23 points gone in fifteen years (92.3% → 69.3%), and most of what was lost was picked up by Chinese brands (3.2% in 2020 → 21.2% in 2025).
North America is the exception: a share of about 37%, unmoved in five years and slightly up in 2025. Chinese brands are kept out by tariffs and the connected-vehicle rules, and hybrids are in favour — the two things holding North America are a wall and the dividend of the old technology. So this page's conclusion splits in two: China and Thailand are being lost, North America is held. The remaining question is how long a wall and a dividend last.
Pages · 3/7
Tesla: what the new rules reward
Tesla leads on a system, not a feature: one software release pushed to the whole fleet at once; a data loop of more than 15 billion cumulative FSD miles (supervised; company disclosure) training the next version; about 1.74 million customers paying for FSD [25]. The new rules reward exactly this — a product that keeps improving after delivery, and driving data as an asset.
Two boundaries, stated up front: the index cannot see profit — page 5 puts the question to the filings. And 15 billion supervised Level 2 miles cannot be set against driverless operating orders; the two measure different things.
Pages · 4/7
Tesla vs Toyota: take "OTA" apart
The gap was never "OTA or no OTA" — Toyota has had it since 2021. Compare instead what can be updated, how wide the platform runs, and where software sits in the organisation.
What can be updated — Toyota before Arene: multimedia, instruments and active-safety software have updated over the air since the 2021 NX; driver-assistance control software appeared only on two flagships, the LS and the Mirai (wirelessly, or wired at a dealer). For the core domains — powertrain, braking — Toyota has never claimed wireless updates in an official document [31]. Tesla: its official wording is a single line — vehicle software continuously gains new features and enhancements, driver assistance included, pushed to the entire fleet; a per-system list is never published [32].
How wide the platform runs — Tesla: one stack across the fleet, new and old cars on the same version. Toyota: Arene is its first software platform built for reuse across models, first fitted to the new RAV4 in 2025, on two models today [31]. "About 50 models by 2030" is a rollout target Reuters attributes to a Toyota spokesperson's confirmation — not a published company plan [21].
Where software sits — Toyota's platform is developed by its subsidiary Woven by Toyota and supplied to vehicle programmes; the cadence of vehicle development still sits with the parent [31]. At Tesla, software and vehicle are one product: a release ships and the fleet changes with it — a structure observable from its products and release pattern, not either company's official account.
Conclusion: what Toyota can change is mostly the cockpit and the safety systems, and software supplies the vehicle programmes. Tesla treats the whole car as a continuously updated product. The difference is scope and position, not zero and one.
Pages · 5/7
The counter-case: profit, on a single definition
7.4%
Toyota · group operating margin — FY2026 (April 2025–March 2026), as reported [6]
5.0%
BYD · group operating margin — calendar 2025, computed by this magazine from its audited annual-report statements [26]
4.6%
Tesla · group operating margin — calendar 2025, Form 10-K [30]
One metric, full years, all from filings. The periods are offset by a quarter: Toyota's fiscal year runs one quarter behind the calendar year. Toyota's automotive segment alone is 6.1% — financial services lift the group figure — and its FY2026 profit absorbed roughly ¥1.38tn of US tariff cost [6].
No one has converted their strength into a decisive margin: the digital index's leader is the lowest of the three, and Toyota's thick profit is earned by the very structure under pressure — software capability has not yet converted into profit, and past profit has not converted into software capability. One more dissection: Tesla's Q3 2026 operating-cost surge is, in its own 10-Q's words, a bundle — AI alongside Optimus, silicon, batteries and new vehicle programmes, plus stock compensation. The filing does not support charging that quarter's profit decline to AI alone [25].
Pages · 6/7
The white-goods mirror: five mechanisms, and how far each has travelled
The same mechanism set ran to completion once, in home appliances. Mapped onto cars, here is where each one stands:
- Under way · Core components standardise In appliances, product differences vanished. In cars, battery cells, e-axles and AI compute are standardising; hybrid integration and vehicle tuning are not yet.
- Halfway · Entry barriers fall In appliances, bought-in parts assembled into brands. Car brands have multiplied too; safety law, recall liability and a decade of aftercare still charge admission.
- Different direction · Production moves Appliance capacity chased cost and hollowed out the home base. Japanese domestic car output is down about 38% from its 1990 peak [5] — the driver is building where the market is, pulled back and forth by tariffs.
- Not yet · Brand and pricing power erode Appliance premiums were ground away by price wars. Not in cars, so far: Chinese brands' three-year residual value in Germany is 47.2%, still below the market average [15]; residuals and credit still defend Japanese pricing.
- Begun, still small · Retreat to components and materials Sony retreated to image sensors, Fujifilm carried its film chemistry into healthcare [18]. In cars, Toyota's external powertrain orders are about $0.56bn, with a target of about $1.7bn by 2032 [14].
Not one mechanism has fully repeated — cars have brakes appliances never had: safety liability, hard regulation, ownership cycles beyond ten years. The mirror is a ruler, not a prophecy.
Pages · 7/7
Three futures: why B is the baseline
Why B is the baseline — The share slopes are already facts: China 23.1% → about 10%, Thailand 92.3% → 69.3% [7][8]. So is the component layer's position: powertrains selling to outside customers, core components still strong. A requires every 2029–30 timetable to land on time; C requires the component layer to fall as well. The evidence for both is thinner than the evidence for B.
- A · Full counter-attack Condition: the software and battery timelines both hit, and share stops falling. Current evidence: Arene is on its second model and solid-state is not yet in production — the weakest of the three.
- B · Structural shrinkage (baseline) Condition: vehicle share follows its current slope while value and profit concentrate upstream. Current evidence: the share slopes and the component orders hold at the same time — the strongest of the three.
- C · The white-goods outcome Condition: the core component layer is displaced too. Current evidence: external powertrain orders are still coming in — not present today.
What would change this call — Any two of three counter-signals, and this magazine downgrades its confidence in B. Note: a downgrade, not a switch to A.
- China share recovers: on the CAAM basis, Japanese brands' full-year share rises two years running; a single quarter's bounce does not count [7].
- Thailand stabilises: share flat or rising for four consecutive quarters. The 2026 halt is the first after six years of decline — not yet a trend [8].
- Solid-state reaches production: cars on sale with it, at over 10,000 units a year (our observation threshold). That proves one component-layer technology, not a restored vehicle business — it counts only alongside signal 1 or 2 [13].
The call stands: vehicle share shrinks structurally, value concentrates upstream. Two signals, and we revise it in the open.
In Q3 2026, Chinese brands took 12.7% of Europe's new-car registrations, ahead of Japanese brands at 11.9%. Three new scoreboards — software, autonomous-driving scale, electrification — ask what is really under threat.
Key takeaways
- Read the opening news in pieces. Hybrids did the heavy lifting in Europe's Q3 crossover (after duties were placed on pure EVs, exports swung to hybrids, which were not yet covered), and September included shipments rushed ahead of new limits. But Chinese carmakers' European registrations rose from about 50,000 to about 700,000 in five years (JATO) — not something one quarter's noise explains. Europe was never Japanese carmakers' main profit market either; the real signal lies elsewhere.
- There are three new scoreboards, and they measure three different things: software and digital capability (the Gartner index: Tesla first at 82.7, Japanese makers from below 20th to last); autonomous-driving scale (Waymo's 500,000 weekly rides are Level 4 operations; Tesla's 15 billion-plus miles are Level 2 fleet mileage — the two are not directly comparable); and electrification share (IEA: about 3% in Japan's home market — a measure mainly of market and policy, not direct evidence about a company's technology).
- Digital leadership has not yet been converted into profit leadership — the counter-evidence any bear case on Japan must answer first. Tesla's operating margin in Q3 2026 was just 2.6%, and its operating profit for the first nine months of 2026 was about $2.1bn. Toyota's operating profit for the year to March 2026 was ¥3.77 trillion, of which the automotive segment alone contributed ¥2.78 trillion. Whether software capability is the variable that decides the contest is, financially, unproven so far.
- The evidence points to incentives and organisation, more than to technology itself, as the reason Japan is slower. Part of the development-cycle gap (about 20 months in a sample of Chinese EV makers versus about 40 months for traditional multinationals, AlixPartners) comes from organisational models; part from vehicle scope, validation standards and company stage. The thicker hybrid profits are, the harder it is to vote to shorten the hybrid era. Buying a compute platform (Toyota's use of NVIDIA) can repair a single point of speed; it cannot repair an organisation.
- The moat is real, but its nature is to buy time. Chinese production inside the walls is at uneven stages: Leapmotor has started production in Spain, Chery is in production in Barcelona (about 17,308 vehicles in 2025), BYD's Szeged plant is still at trial production, SAIC's Galicia plant has been announced but not built, and BYD's Turkish plant has been shelved. Hybrids are not a technology at the end of its life either: transition speeds differ by region, and Toyota's multi-pathway approach is financially rational. On residual values, the evidence cuts against Chinese brands: three-year value retention in Germany is markedly below the market average (DAT; the Chinese-brand sample is mostly MG) — a bill for brand and finance they have not yet paid.
- Judgment and falsification: the base case is structural shrinkage with value retained upstream; Toyota completing the transition alone is the upper bound, and the "double loss" the lower bound. If two of three counter-signals occur — Japanese share recovering in China, Southeast Asian share stabilising for four straight quarters, cost-competitive solid-state mass production — the judgment is revised downward. That is an editorial rule set in advance, not a statistical proof.
Japanese cars will not disappear the way white goods did: 5.57 million jobs, a fifth of the country's exports and the world's No. 1 carmaker are still there, and Toyota alone earns several times Tesla's operating profit. But on three new scoreboards — software, autonomous-driving scale, electrification speed — Japanese makers sit at the back, and the old scoreboards are slipping too. Our judgment: the most likely outcome over the next decade is a structural shrinkage of the finished-car map, with profit migrating toward the systems and components layer — and the split will come between companies. What would confirm or overturn that judgment is set out in Act IV.
Tesla: software and vertical integration
The power to define the product sits in software and AI. In-house chips, a central computing architecture, vehicle software, direct sales and a charging network are all its own; after a car is sold it keeps changing through over-the-air updates. The strength is iteration speed and the data loop. The weakness is on the record: the car business earned an 18.5% gross margin in Q3 2026 (reported basis), but operating expenses surged on AI investment and the group operating margin was just 2.6% — digital leadership has not yet been converted into profit leadership.
Toyota: a machine for manufacturing and hybrid scale
World No. 1 in volume, reliability and cost control; hybrids are among the most profitable technology routes on the road today. Software follows a hybrid path of its own: its platform Arene runs applications and data, while the AI-driving compute chips are bought from NVIDIA. The strength is cash flow and organisational depth. The problem is that its position on the new scoreboards does not match its No. 1 position in sales.
BYD: batteries and cost, integrated
Batteries, semiconductors and finished cars under one roof, competing on cost and launch speed; it sold 4.60 million new-energy vehicles in 2025. The cost is in its accounts: the gross margin of its automobiles-and-related segment fell by about 1.8 points in a year, and net profit attributable fell about 19%. The home market's profit pool has been thinned by the price war, and going abroad is no longer a choice but a requirement.
Waymo: it sells only the driver
It is not a carmaker and sells no cars. It sells driverless operating services: 500,000 paid rides a week in the US (September 2026). It proves that "driving" itself can be a standalone business — the most uncomfortable position for a carmaker: the most valuable part of the car may not belong to whoever builds it.
In the third quarter of 2026, Chinese brands sold more cars in Europe than Japanese brands for the first time: a registration share of 12.7% against 11.9% (Dataforce figures, reported by Bloomberg). In September alone, Chinese brands reached 14.5%. Five years earlier, the figure was about 1%; in the same year, Japanese brands summed from the five makes in ACEA's brand table (Toyota Group, Nissan, Mazda, Mitsubishi, Honda) held about 11%.
Take the headline apart. There are three footnotes, and each matters more than the last.
First, the leaders were hybrids, not pure EVs. From October 2024 the EU placed countervailing duties on Chinese-made battery EVs (BYD 17.0%, Geely 18.8%, SAIC 35.3%, on top of the 10% base duty); hybrids were initially not on the list. Chinese exporters duly swung their mix toward hybrids: in the first half of 2026, Chinese brands took 14% of Europe's hybrid market and 25% of its plug-in hybrid market — in 2024, both figures were 2% (ACEA).
Second, September's spike had a deadline in it. The EU and China have reached an understanding on hybrid trade (European Commission joint statement, October 9). According to Reuters, the arrangement would cap Chinese hybrid exports to Europe at 350,000 vehicles a year for four years, possibly from December — while this year's uncapped flow is heading for about 800,000. Shipping before the gate closes inflated the third quarter.
Third, "Chinese brands" includes MG. MG is a British marque founded in 1924, owned by SAIC since 2007; Dataforce counts it as Chinese. That is a matter of statistical attribution, not an error — but readers should know what they are looking at.
One more qualification after the footnotes: registrations are not profit. Around two-thirds of new cars in Europe move through corporate and leasing channels (German figure, KBA), where buyers calculate on total cost and residual value. Nor was Europe ever Japanese carmakers' main profit market: starting with Toyota's entry in 1963, sixty years of work built a share of roughly 12%. Losing a market that was never strong carries more symbolism than financial damage.
The trend itself, though, stands. JATO counts Chinese carmakers' European registrations rising from about 50,000 in 2020 to about 700,000, with more than 1.3 million expected in 2026 and over 200 models on sale. One quarter's crossover can be padded; a five-year curve cannot.
So the real question is not "did Japan lose Europe?" It is: what exactly is under threat — Japan's market share, its technology, or its position in the value chain? The four acts below test the question in that order: what changed on the scoreboard (Act I), why the gap formed (Act II), how much of Japan's old advantage survives (Act III), and what the white-goods mirror actually shows (Act IV).
Act I. The scoreboard is changing: three new measures, three different things
A note on method first. The three bodies of evidence below do not measure the same thing, and there is no combined league table. Keeping them separate makes the conclusion clearer, not weaker.
Software: at the bottom of a capability ranking
Gartner's Digital Automaker Index 2026 (published August 2026) scores 24 carmakers across nine categories for a total of 1,000 points, presented as percentages. The heaviest weights fall on vehicle software and electrical/electronic architecture (260 points) and electrification (200 points), followed by autonomous driving and in-vehicle experience, connectivity, user experience, culture and talent. By Gartner's own definition, the index assesses a carmaker's ability to turn its vehicle digital-technology assets into business benefit, and is positioned as a leading indicator of future performance potential; it rests on public information plus analyst judgement. The results: Tesla first at 82.7, NIO (73.1) and Xiaomi (69.2) second and third, and the entire top eight made up of EV or software-native companies. The best legacy maker is Hyundai-Kia, tenth at 37.5. Japan's makers are at the bottom: Toyota scored in the mid-20s and ranked below 20th (reported by South Korea's ET News; no citable exact score exists, and we do not print one), Nissan ranked 23rd, and Mazda last, 24th at 22.1.
How this index should and should not be used needs saying plainly. It is a consultancy's composite assessment, not a laboratory measurement. What it supports is: "on the capability to transition to software-defined vehicles, and on what has actually been deployed in cars on sale, Japanese makers are clearly at the back." It does not support "Japanese cars have poor software," and it does not by itself say who wins. Cross-checked against observable deployment, the direction holds: Toyota's own software platform, Arene, is so far fitted to just two models (the 2025 RAV4 and the Lexus ES), with coverage of about 50 models planned by 2030, while Tesla's vehicle-software updates already reach its entire fleet. The low ranking is not an injustice. But what it measures is transition progress, not the final result.
BYD's position deserves a look as well: eighth, at 43.6. A giant of volume and cost sits mid-table on digital capability — the clearest illustration that the three scoreboards measure different things.
Autonomous driving: separate the three kinds of "miles" first
Autonomy is where numbers mislead most easily, because the market circulates three entirely different measures.
Tesla runs the Level 2 fleet route. Its FSD (Supervised) is driver assistance that requires constant supervision; it is not driverless operation. By Tesla's disclosure, cumulative miles driven with FSD passed 15 billion by the end of September 2026 (the 10-Q describes the growth in 2026 as exponential) — one of the world's largest driving-data pools. Two qualifications must be printed alongside. First, these are miles driven by owners under supervision, not driverless operating miles. Second, the commercial conversion can be verified only in part: Tesla counts about 1.74 million active FSD customers (Q3 2026, one-time purchases and subscriptions combined, per its shareholder materials), but the monthly-subscriber split and FSD revenue are not disclosed. Its robotaxi service launched in June 2025; by the company's own Robotaxi Safety Report (October 2026), driverless miles without a safety monitor reached about 3.11 million from January to mid-October 2026 across Austin, Dallas, Houston, Miami, Orlando and Tampa, while the San Francisco Bay Area operates with a safety driver under California rules. The purpose-built Cybercab joined the Austin fleet in September 2026 (10-Q), after which NHTSA opened an investigation into its compliance. The robotaxi fleet's size, revenue and per-vehicle economics remain undisclosed.
Waymo runs the Level 4 operations route. In September 2026 it was completing more than 500,000 paid, fully driverless rides a week across 14 US metropolitan areas, with a fleet above 4,000 vehicles and a target of a million rides a week by year-end. Baidu's Apollo Go peaked above 350,000 rides a week in March 2026, with cumulative rides above 22 million (both company-stated). Ride counts are not the whole of technical advantage either: whether operating data can be used for training, and how many edge cases it covers, depends on data rights and scenario diversity. Even so, the iteration cadence fed by hundreds of thousands of real operations a week is not something laboratory testing can substitute for.
Japan's Level 4 exists. It is simply at a different scale. On May 28, 2023, a service in Eiheiji, Fukui prefecture (operated by the town company ZEN Connect, with vehicles lent free of charge by AIST) became Japan's first Level 4 service under the "specified automated operation" permit system created by the revised Road Traffic Act — fare-charging, but in the form of small vehicles capped at 12 km/h on a fixed route of about 2 km (this first service has been suspended since April 2026, after its vehicle and system maintenance terms expired — resumption undecided). Since then, Haneda Innovation City in Tokyo (permitted in 2024, running free of charge) and a scheduled bus service in Sakai, Ibaraki (permit granted November 2025) have followed, and while the government's target is automated-driving services at more than 100 locations by the end of fiscal 2027, only nine sites nationwide held the permit at the end of 2025. The accurate description of the present state: Japan has the law, it has fare-charging services, and it has technology companies such as Tier IV (whose system enters limited-area demonstrations at 50 locations from 2026) — but operating scale remains fixed-route, low-speed and small-fleet. The first city-scale attempt waits until 2027: Waymo, the ride-hailing platform GO and Nihon Kotsu have agreed to launch a driverless taxi service in Tokyo, scaling the fleet gradually to about 100 vehicles, with regulatory approval still to come. The system that drives will be Waymo's; the Japanese partners run the hailing and the operations.
Three measures, three different businesses. Fusing them into a single "who is ahead" table is the most common error in coverage of this field.
Electrification: Japan's 3% measures a market, not a company
The IEA's Global EV Outlook 2026 counts 2025 electric car sales (battery-electric plus plug-in hybrid) at more than 20 million, 25% of new cars worldwide; China at about 55%, Europe 28%, the United States below 10%; Japan at about 3% — of which battery-electric alone is only 1.6% (compiled from JAMA-affiliated statistics).
Japan's low figure needs three separate explanations; it cannot be lumped into one. The first layer is environment: housing mix, charging conditions and the cadence of subsidies differ from Europe's, and the United States is also below 10% — low penetration is not uniquely Japanese. The second layer is choice: Japanese makers built hybrids into the world's strongest product line, and conventional hybrids do not count in the "electric" figures above; Japan's hybrid share is a different picture. The third layer is transition speed itself — and at company level the numbers are genuinely stark. In 2024, of the 10.16 million vehicles Toyota sold, only about 140,000 were battery-electric, 1.4% (BYD sold 4.27 million new-energy vehicles the same year). Honda cut its ten-year electrification and software investment from ¥10 trillion to ¥7 trillion in May 2025 and lowered its 2030 EV sales-share target from 30% to about 20%. Home-market penetration alone does not prove a company lacks the technology. But the companies' own investment and output figures show that electrification has genuinely sat low in Japanese carmakers' order of priorities.
Act I's limited conclusion: on all three new scoreboards, Japanese makers are at the back. That is a fact. But each scoreboard measures capability and deployment aimed at the future; none measures profit directly. And the old scoreboard is not static either: Japanese brands' share of China's passenger-car market fell from 23.1% in 2020 to about 10% in January–November 2025 (in China, Honda's sales fell by about 60% over six years and Nissan's halved, while Toyota held roughly flat — the split is already visible here). In Thailand, Japanese brands' share fell from 92.3% in 2010 to 69.3% in 2025.
Act II. Why the speed of transition differs: organisation, incentives, and the opportunity cost of existing profit
Development cycles: the gap is real, but it cannot all be charged to organisation
AlixPartners counts about 20 months for a Chinese EV maker to develop a new car, against about 40 months for a traditional multinational; the average age of Chinese brands' models on sale is 1.6 years, against 5.4 years for foreign brands. McKinsey's figures are similar: about 21 months from concept to production for Chinese newcomers, 36–48 months for carmakers elsewhere.
The samples first: the 20 months describe Chinese EV makers, the 40 months an average of traditional multinationals — not Japan specifically; and "model age" measures how fresh the showroom line-up is, not development time as such. How much of the gap is organisational model? At least four forces are at work. First, organisational decision-making — a system that plans software and hardware separately and reviews in layers is inherently slower. Second, development scope — an all-new platform, a facelift and a full model change are not the same "developing a car". Third, validation standards — the culture of clearing every problem before production is the source of Japanese cars' reliability, and it is also the price of speed. Fourth, company stage — young companies carry no legacy model lines and no supplier commitments to protect. Charging all four forces to "Japanese companies are conservative" is laziness. Put accurately: the organisational model is the one force among the four that Japanese carmakers can most change themselves — and the hardest for them to change.
Tesla and Toyota: two organisations, two prices
Tesla's speed comes from designing the whole car as one system: its own autonomy chips, a central computing architecture, software pushed from headquarters, faults fixed by remote update — it does not even carry dealer inventory as a buffer. The price is also on the record: its automotive gross margin was 18.5% on a reported basis in Q3 2026 (about 18.1% excluding regulatory credits, our calculation from its 10-Q), but operating expenses rose 39% year on year (R&D up 69%) and its group operating margin in the third quarter of 2026 was just 2.6%. Part of its speed is bought with current profit.
Toyota's slowness is the other side of a different system: long-term ties with keiretsu suppliers (the Denso–Toyota relationship is the emblem), development organised model by model, problems cleared before production. In the quality era this system was a moat — Toyota's reliability and its residual values are the interest it pays. Its structural problem in the software era is that the software division is a subordinate part of vehicle development, not the party that defines the product. Toyota's answer is Arene: its own vehicle software platform, carrying applications, data and development tools, first fitted to the RAV4 in 2025, now on two models, planned to cover about 50 models and roughly 10 million new cars a year by 2030, and to be offered to alliance partners from around 2035. Three stages must be kept distinct — "announced", "fitted to two models" and "fitted across the range" are three different events, separated by five years of execution. The investment is not only this: Toyota and NTT have agreed to invest ¥500 billion jointly between 2024 and 2030 in mobility AI and software infrastructure. What is scarce is not money; it is the calendar. On August 31, 2026, Honda and Nissan signed an agreement to develop and standardise core controllers, vehicle operating systems and middleware together, for fitment from fiscal 2029: two companies that competed for half a century have begun writing software jointly — itself evidence that a single organisation could not close this gap alone.
Buying a platform: what is bought, and what is not
"Toyota uses NVIDIA — so is the intelligence NVIDIA's?" The question has to be answered layer by layer. The technology stack of an intelligent car has at least six layers:
- AI compute chips and hardware: Toyota's next-generation cars will use NVIDIA's DRIVE AGX Orin (announced January 2025). Japan's own champion, Renesas, has its flagship R-Car X5H (3nm, 400 TOPS) reaching mass production only in 2027, and its strength remains in real-time, safety-critical control — body and chassis. At this layer, Japanese carmakers are buyers for now.
- Operating systems and middleware: in the autonomous-driving compute domain, NVIDIA supplies the chip plus DriveOS, its safety-certified base system. The application platform across the whole vehicle is Toyota's own Arene — which, in Toyota's own description, abstracts differences in hardware into a uniform interface and carries applications, development tools and data. The two layers are not the same thing, and they do not have the same supplier.
- Electrical/electronic architecture: defined by the carmaker itself. Sony Honda Mobility chose Qualcomm's Snapdragon Digital Chassis for its next-generation architecture — with the caveat that Qualcomm's scope of supply varies by carmaker, from silicon alone to the full software stack; it cannot be generalised.
- Driver-assistance applications: Toyota Safety Sense is Toyota's own application layer, running on compute it has chosen.
- Vehicle control and safety validation: retained by Toyota — and its core capability.
- Whole-vehicle integration, user data and continuing services: retained by Toyota. Arene exists precisely for this layer.
So "uses American chips" does not yield "its intelligence is controlled by Americans": applications, integration, data and the customer relationship all remain in Toyota's hands, and buying a compute platform has genuinely shortened its time to market. The risk is a different thing, and it is real: at the layer of AI compute and its software ecosystem — the layer with the thickest margins, the hardest standards and the highest switching costs — Toyota is a customer rather than the host, and an ecosystem's gravity strengthens with time.
Our reading — Our reading
Stated as fact, "the intelligence is rented" would be inaccurate, and we do not conclude it. Its accurate form is a strategic-risk judgment: if the layer that defines the experience (AI compute plus its software ecosystem) is bought in over the long term, what the carmaker keeps is the profit of integration and manufacturing, and what it may give up is the right to define the next generation of the product. Definition rights are exactly what white goods lost. The risk at this layer deserves marking in red — but today it remains a risk, not an ending.
This act's answer: the bottleneck is, first, opportunity cost
Of three candidate explanations — insufficient technology, mismatched organisational incentives, and the opportunity cost of the existing profit model — the evidence is weakest for the first. Japan has component-layer capability at Renesas, Denso and Sony, and individual missing points can be bought in. The evidence is strongest for the third, and next for the second. Hybrids are Japanese carmakers' genuine technological summit, and also the source of today's profit: the bulk of the ¥2.78 trillion of operating profit Toyota's automotive segment earns in a year still comes from petrol and hybrid vehicles. Asking the organisation to shorten the hybrid era with its own hands means ordering its most profitable division to revolutionise itself — the innovator's dilemma of the textbooks, which requires nobody to be conservative or foolish, only quarterly accounts that look good enough. Kodak did not fail to know about the digital camera; Kodak invented it. What killed it was film profit so thick that every transition plan looked "uneconomic" on the financial measures of the day.
Act III. The counter-case: how much of Japan's advantage is left — what is a moat, and what is only time
Before the bear case, the case for Japan's car industry continuing to be strong, stated at full strength.
Fact — Reserves and moats (all facts; sources at the end)
- Employment: 5.57 million people work in car manufacturing and related industries — 8.0% of all Japanese employment (JAMA, The Motor Industry of Japan 2026).
- Exports: car exports of ¥21.9 trillion in 2025 (including parts and motorcycles), 19.9% of Japan's total exports; finished-car exports of 4.17 million.
- Production: Japan's domestic car production was 8.41 million in 2025; the 1990 peak was 13.49 million — the home base shrinks while the global footprint grows. Two different directions.
- The leader: Toyota Group sold 11.3 million vehicles worldwide in 2025, world No. 1 for a sixth straight year; operating profit hit a record ¥4.80 trillion in the year to March 2025, then ¥3.77 trillion the following year.
- The factory network: Japanese makers built more than 3.1 million cars in the United States in 2025, about a third of US production (JAMA USA).
Profit is the hardest counter-evidence. Put the three models' finances side by side, and the picture is not quite the popular narrative:
| Company | Latest full year | Volume | How the car business earns | Profit |
|---|---|---|---|---|
| Tesla | Calendar 2025 (and Q3 2026) | 1.64M deliveries | Automotive gross margin 18.5% (Q3 2026, reported basis; ~18.1% ex-credits, our calculation) | Operating profit of ~$2.1bn in the first nine months of 2026; operating margin 2.6% |
| Toyota | FY2026 (to March 2026) | ~11.28M retail (incl. Daihatsu, Hino) | Automotive segment operating margin 6.1% (group 7.4%); no separate automotive gross margin disclosed | Group operating profit ¥3.77tn, of which automotive ¥2.78tn |
| BYD | Calendar 2025 | 4.60M new-energy vehicles | Automobiles-and-related segment gross margin 20.49% (22.31% in 2024) | Net profit attributable ¥32.6bn (~$4.6bn); net margin ~4% (our calculation) |
Three models, three long suits — and none of them has converted its long suit into a clear profit advantage. Tesla, the strongest in software, runs a group operating margin below Toyota's. BYD, the strongest in cost integration, had about 1.8 points of segment gross margin eaten by the price war in a single year, and net profit fell about 19%. Toyota, the largest in scale, holds its margin with the "old skills" of hybrids and cost control. The table draws a line under Act I's conclusion: software capability is the new entry ticket, but there is as yet no evidence that it alone decides profit. Whoever first proves "software leadership → profit leadership" will have rewritten this industry's rules. Nobody has proved it yet.
Hybrids are not a technology at the end of its life. Writing hybrids off as a transitional technology on its way out overlooks three facts. Transition speeds differ by region — charging infrastructure, housing stock, electricity prices and policy cadence all differ. The EU's 2035 zero-emission target for new cars carries a review mechanism, and its implementation path still has variables. And Toyota's multi-pathway strategy (different weights for hybrid, plug-in hybrid, battery-electric and hydrogen in different markets) is financially rational — hybrid profit is itself paying for the transition. Honda's cut of its electrification investment from ¥10 trillion to ¥7 trillion can equally be read as a correction to the pace of demand, not only as retreat; both readings are available, and the evidence does not licence choosing only one.
Residual values and brand are the lesson Chinese brands have not yet paid for. Europe's corporate and leasing channels price cars on three-year residual values. On that measure Chinese brands currently lag clearly: in Germany, DAT's figures (three-year value retention) put Chinese brands at 47.2%, with the market average well above — with the qualification stated up front: DAT's Chinese-brand sample is about 80% a single brand, MG, and still small. On a forecast basis in the UK, CDL shows Chinese models already level with non-Chinese ones (46.2% versus 46%) — but a forecast and a transaction are different things, and we print both numbers rather than the convenient one. No separate time series for Japanese brands' residual values exists in public sources, so we do not assert that "Japan's residual-value advantage is being eroded": the present state is an advantage, and whether it converges is a question for future transaction data.
Now test durability, item by item.
Tariffs are not competitiveness. A wall's function is to keep imports out; it cannot stop production inside the wall. Progress by Chinese production inside the walls has to be read in stages. In production: Chery's joint-venture plant with Ebro, on the site of Nissan's former Barcelona factory, restarted production in November 2024 (2025 output was about 17,308 vehicles, all under the EBRO brand; production of Chery's own Omoda and Jaecoo brands there has not begun); Leapmotor's B10 formally started production at Stellantis's Zaragoza plant in October 2026. At trial production: BYD's Szeged plant began trial production at the end of January 2026; the company says mass production starts in the fourth quarter of 2026, and no output figures have been disclosed. At agreement stage: Geely and Ford formed a joint venture in July 2026 to build cars at Ford's Valencia plant, with the first cars expected in 2028; Chery and Nissan signed a non-binding memorandum on contract manufacturing at Nissan's Sunderland plant. Still on paper: SAIC's Galicia plant has been announced as a plan (production targeted for 2028) but construction has not started and central-government approval is incomplete; BYD's Turkish plant has been shelved — never built, and its import-tax privileges have been suspended. Compressing these five states into either "Chinese production is already inside the walls" or "it is years away" would both be wrong. The accurate picture: the gate is open a crack, and the speed beyond it depends on execution over the next few years.
Where the bought time is spent is another indicator. In the capital allocation Toyota announced during its record-profit period, buybacks and dividends took a large share (for FY2025, a buyback ceiling of ¥1 trillion and total dividends above ¥1 trillion, alongside ¥1.7 trillion of transformation investment). A buyback is not a sin; returning cash is a normal decision for a cash-rich large company. But a moat's value is timed by the competitor's progress, not by the financial calendar — and that account can only be settled in retrospect.
This act's conclusion: Japan's strengths divide into two piles. One is long-term moats: manufacturing and safety-validation capability, brand and service networks, residual-value credit, the balance sheet, and the craft of hybrid system integration. These do not disappear because a software ranking is low. The other is transitional advantages: tariff shelter, the hybrid demand window, and present market share — whose common property is that they depreciate automatically with time. The point of a moat is that it buys an option on transformation. An option that is not exercised is, at expiry, just paper.
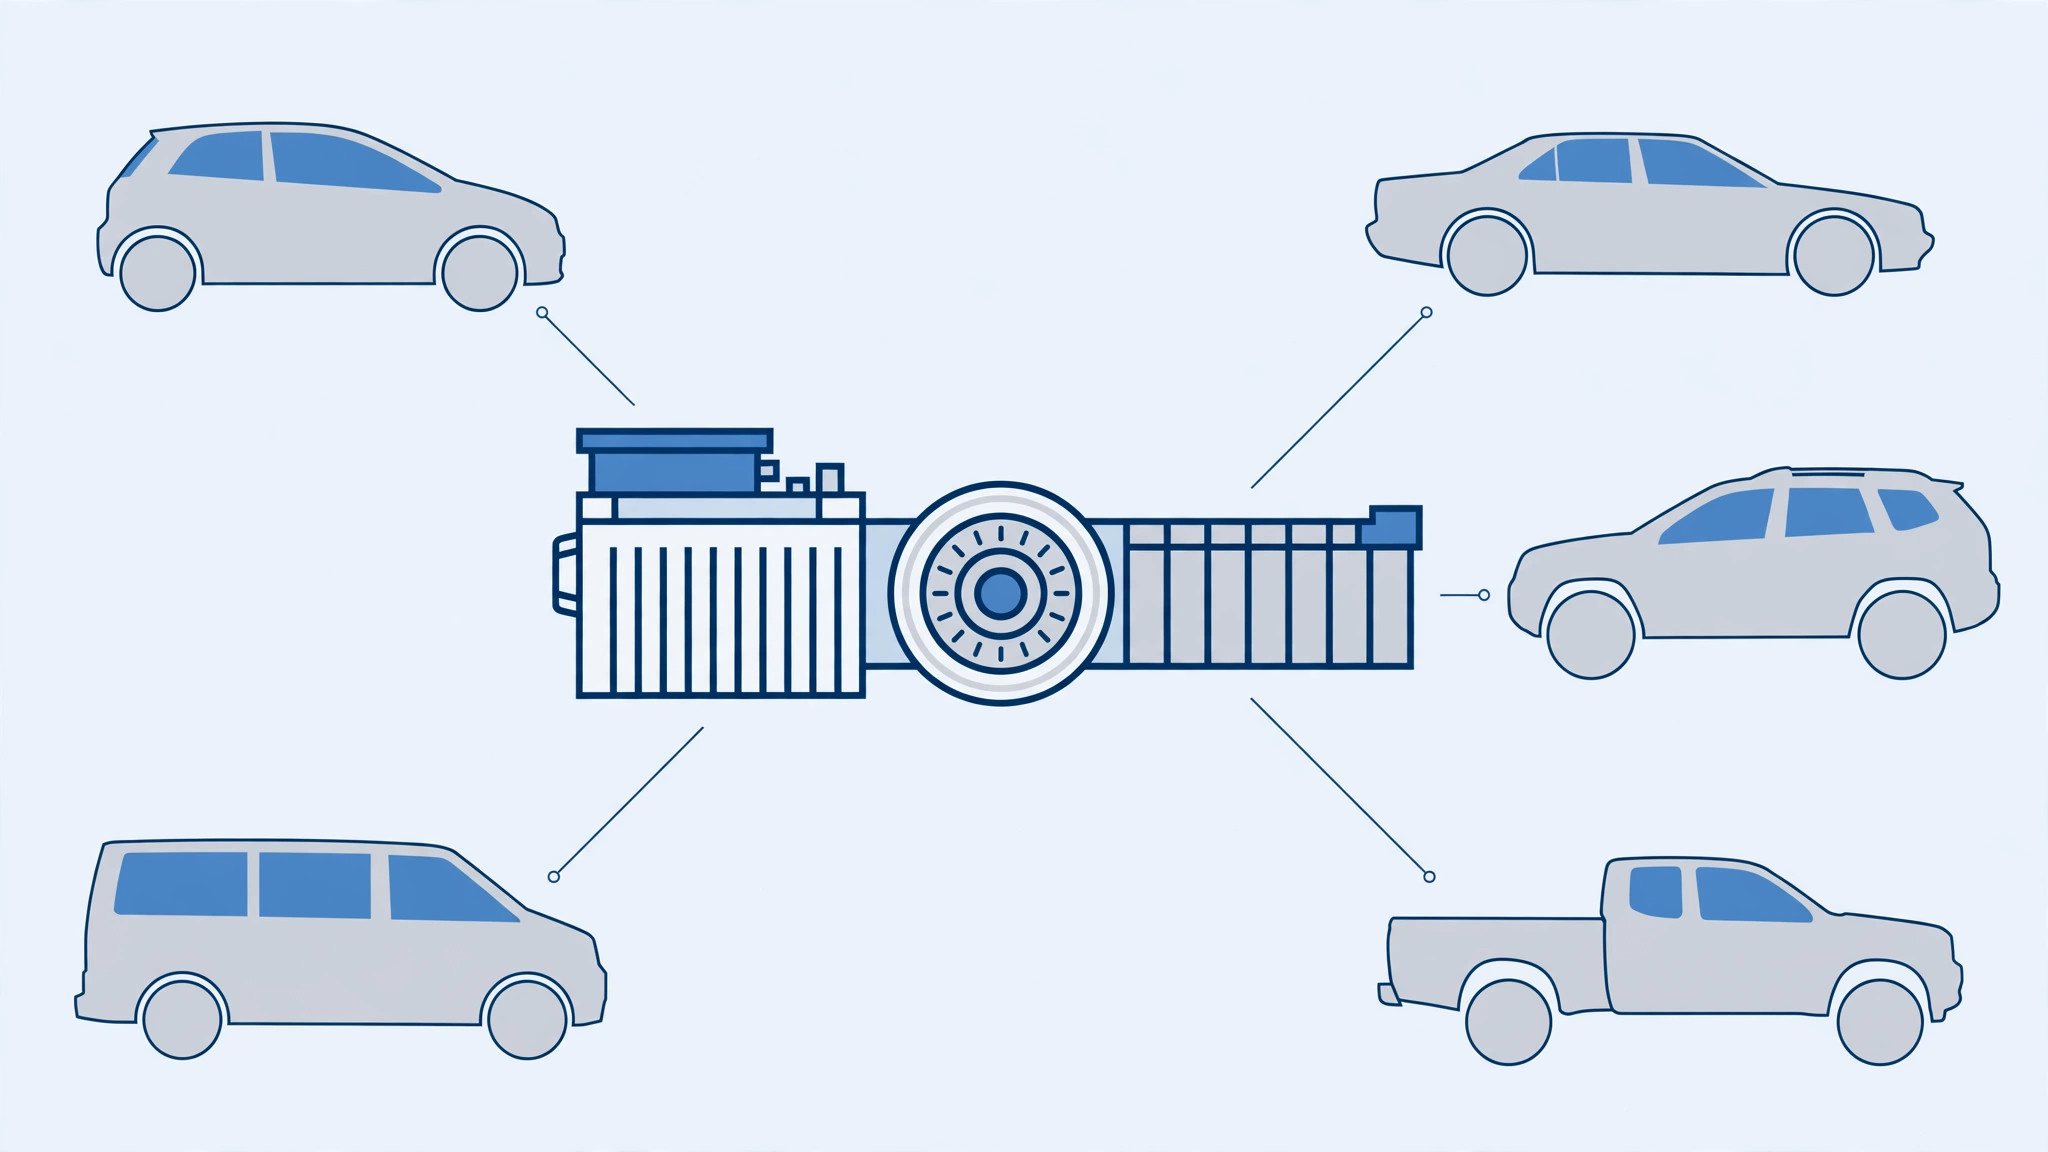
Act IV. The mirror and the judgment: the white-goods mechanism, the Tesla test, and three futures
The appliance mirror: five mechanisms, checked one by one
First, the white-goods endings themselves (all from the companies' announcements at the time): in 2011, Sanyo sold its washing-machine and household-refrigerator businesses to Haier; in 2016, Hon Hai took 66% of Sharp for about ¥388.8 billion, and Toshiba transferred its appliance business (80.1% of Toshiba Lifestyle) to Midea; in 2020, 60% of Hitachi's overseas appliance business moved into a joint venture with Turkey's Arçelik. But a list is not an argument; the mechanism is. Five mechanisms, checked against cars:
- Standardisation of core components (appliances: panels and compressors became buyable, and finished-product differences vanished). Cars: standardisation of batteries and electric drive is advancing, and AI compute platforms are already off-the-shelf goods. This one is under way — but powertrain integration, hybrids above all, has not reached appliance levels of standardisation.
- Falling entry barriers (appliances: anyone who could buy the parts could assemble a brand). Cars: entry into finished vehicles has genuinely become easier (the number of Chinese newcomers is the evidence), but safety law, crash standards and recall liability still tax the entrants. Half happened.
- Global production transfer (appliances: production followed cost, and the home country hollowed out). Cars: Japan's domestic production is down 38% from its peak, but the main direction of transfer is "build where the market is," and tariff policy pulls in the opposite direction. A different direction.
- Loss of brand and pricing power (appliances: the Japanese brand premium was ground away by channels and price competition). Cars: Japanese brands' residual values and brand credit are, for now, intact (Act III). Not yet happened — which is why residuals are worth watching.
- Retreat from end products to components and materials (appliances: Sony's sensors; Toshiba's and Panasonic's components). Cars: Denso, Renesas and Sony's sensors sit in this layer, and Toyota has begun selling powertrains externally. Begun, but still small in scale.
The limits of the analogy: a mirror is not a prophecy
Four limits must be written alongside. First, a car is a product with heavy safety liability, heavy regulation and a service life beyond ten years; the pace at which software and components can be substituted is bound to be slower than in appliances, and the carmakers' safety-validation capability is itself a barrier appliances never had. Second, "home appliances" is not one industry: television was lost to panel standardisation, white goods to cost and channels, and digital cameras were replaced wholesale by a new product category, the phone. Three different ways of dying cannot be merged into one case and applied to cars. Third, Fujifilm is often cited as the "retreat upstream" example, but it walked a different road: it carried the capabilities of film chemistry across industries into medicine and electronic materials (in the year to March 2026, the two together were 46.3% of revenue; imaging was down to 18.7%). That is capability reuse, not selling components. Sony's sensors are the "retreat to a core component." The two roads must not be conflated. Fourth — and most important — to this day, no Japanese finished-car brand has been acquired by foreign capital or disappeared. For cars, the appliance ending remains a scenario, not a trajectory already entered.
The Tesla test: which of three hypotheses fits the evidence?
The opening question — where is value moving? — tested against the most extreme specimen, Tesla, admits three candidate answers.
Hypothesis A: software and the data loop are becoming the core capability that decides long-term competitiveness. The supporting evidence is the hardest: Tesla's fleet-wide over-the-air updates, more than 15 billion miles of FSD fleet data, and the top of the Gartner index are deployed scale that actually exists; Japanese carmakers' own catch-up plans (Arene across the range by 2030, Honda–Nissan fitment from fiscal 2029) concede the scoreboard. The qualification is equally real: as Act III showed, software leadership has not yet been converted into profit leadership at Tesla. A holds as a necessary condition; it has not yet held as a sufficient one.
Hypothesis B: advantage is concentrating in the few companies that hold the complete intelligent system. Tesla is in fact this hypothesis's strongest evidence — and the strongest counter-example to the popular claim that "the intelligence layer is being fully modularised." The car industry's strongest software player walks the road of vertical integration, developing chips, system and applications in-house; it does not buy modules. If value is concentrating in "whoever defines the system," then the problem for carmakers adopting NVIDIA or Qualcomm solutions is not "being modularised" but "the system definer is somebody else." Modularisation and integration are proceeding simultaneously, at different layers: the manufacturing layer is getting cheaper and more commoditised; the system layer is concentrating upward.
Hypothesis C: several competitive models will coexist for a long time. Supporting evidence: Toyota's hybrid and manufacturing system still earns money in North America, Japan and Southeast Asia; BYD's cost model is expanding in price-sensitive markets; Tesla's software model holds the premium technology mindshare — and the three models' customers and markets do not fully overlap. The qualification: coexistence does not mean frozen shares; the gains and losses at the margin continue (Act I).
Our assessment: the evidence best supports a combination of B and C, with A as a component of B. Accordingly, we revise this article's original mechanism. Not "the intelligence layer modularises and Japanese finished cars are commoditised," but: the manufacturing layer is being commoditised while the system layer concentrates; a carmaker's fate depends on whether, at the system layer, it is a definer, a partner, or merely a customer. Japanese makers currently sit between the second and third positions. That is where the risk is. But positions can move: Toyota and Waymo announced a collaboration in April 2025 to explore putting Waymo's autonomous-driving technology into Toyota's personally owned vehicles, with Woven by Toyota participating — Japanese makers are not only sitting in the customer's seat; they are also negotiating for the partner's seat.
Three futures: conditions, evidence, counter-evidence
Scenario A: successful transformation. Finished-car brands keep their competitiveness while software and service revenue grows. Conditions: Arene is fitted on schedule and generates continuing over-the-air and service revenue; the Honda–Nissan joint platform launches as planned in fiscal 2029; Japanese makers' positions in assessments such as Gartner's improve markedly. Current support: Toyota's cash flow (¥3.77 trillion of operating profit in a year) is ample for long-term investment, and it holds several partnership lines — NVIDIA, Waymo and others — at once. Counter-evidence: every catch-up timetable sits in 2029–2030, and competitors will not wait in place.
Scenario B: structural shrinkage (our base case). Some finished-car brands and share continue to be lost, while Japanese companies keep important positions and profit in powertrains, core components, materials and system integration. Conditions: finished-car share continues along Act I's slope; the upstream layers are not taken by Chinese suppliers at the same speed; Toyota's external powertrain sales grow from a spark into a business (per Automotive News' report of the investor-event disclosure: about $560 million of orders in 2026 and a target of about $1.7 billion in 2032 — Toyota has issued no formal release and no buyers are confirmed, so the numbers should be discounted; but the direction is consistent with Scenario B). Counter-evidence: if Chinese suppliers climb the components layer at the same speed as the finished-car layer, B slides into C.
Scenario C: the double loss. Bargaining power is lost in both finished cars and core intelligent platforms, and the industry's value added declines persistently. Conditions: the software-defined-vehicle gap is still unclosed after 2030, and the components layer is substituted as well. Current evidence: the weakest of the three — Japan's components layer (Denso, Renesas, Sony's sensors) is strong to this day, and distress of Nissan's kind (two fiscal years of net losses totalling more than ¥1.2 trillion, 20,000 jobs cut under Re:Nissan) is so far one company's governance and product problem, not the industry's financial picture. C is a tail risk, not the base case.
Judgment, indicators, falsification
Judgment: Japan's base case for the next decade is B. Toyota has a possibility of achieving A on its own. The evidence for the industry as a whole sliding to C is, at present, insufficient. What decides the direction is not any single technical parameter; it is whether Japanese carmakers can win back at least part of the system layer's definition rights before the "transitional advantages" of Act III finish depreciating.
Four leading indicators to watch (with definitions and how to read them):
- Real fitment scale of software platforms: the number of models fitted with Arene (two today; a target of about 50 by 2030) and the timing of the first production car on the Honda–Nissan joint platform. Watch execution, not launches.
- Profit and residual values in overseas markets: whether Japanese brands hold volume and margins in Europe and North America; and whether Chinese brands' residual values (transaction-based measures such as DAT's) converge to the market average — if convergence happens, the moat's quality must be re-rated.
- Toyota's non-automotive profit: Nikkei reported in September 2026 that Toyota has an internal target of ¥3 trillion of operating profit from businesses other than new-vehicle sales by fiscal 2030 (up about 40% from a fiscal-2025 base of roughly ¥2.1 trillion). But mind the definition: the ¥3 trillion is a management measure that cuts across the reported segments — genuine parts, sales finance, leasing, used cars and software updates — and cannot be tracked from segment reporting: financial services and 'other' together earned only about ¥0.98 trillion in FY2026, because much after-sales profit is booked inside the automotive segment. External powertrain sales and future Arene supply can likewise be tracked only through investor-event disclosures. If the target is delivered, Scenario A's weight rises; until Toyota publishes a verifiable measure, we treat it as a reported signal, not load-bearing evidence.
- Whether development cycles and profit improve together: new-model cycles shortening while the automotive segment's margin does not collapse. Speed bought at the price of profit does not count as a successful transformation.
What would overturn our judgment: by 2028, (1) Japanese brands' share in China recovering on a sustained basis; (2) Japanese brands' Southeast Asian share stopping its fall — or recovering — for four consecutive quarters; (3) a Japanese company achieving cost-competitive commercial mass production of solid-state batteries (Toyota and Idemitsu target commercialisation in 2027–2028, with Idemitsu's large pilot plant to be completed within 2027; Nissan's pilot line is running, targeting fitment in fiscal 2028). If two of the three occur, the "structural shrinkage" judgment is revised downward. A disclosure first: the three items are not fully independent (all are affected by the same product cycle), and "two of three" is an editorial rule we set in advance to stop ourselves moving the goalposts afterwards — not a statistical proof. In the other direction, if Nissan is forced into a passive consolidation before 2027 and Chinese brands' European residual values climb above the market average on a transaction basis, the speed of shrinkage gets revised upward.
Finally, an honest account of what we know and what we do not. What we know: the positions on the three new scoreboards, the current state of the financial comparison, the composition of the moat, and the stages of inside-the-wall production — all of it sourced. What we do not know: when, and in what form, software leadership converts into profit; whether Chinese brands' residual values will converge; whether the 2030 Arene timetable will repeat the delays familiar from Japanese industry. Japan's car competitiveness over the next decade ultimately depends on a variable that cannot be written into a financial statement in advance: whether its organisations can complete, while profits still look good, the kind of reform that is usually only approved once profits look bad.
If, ten years from now, Japan's car industry had only two or three finished-car brands left, but one in three hybrids sold worldwide used a Japanese powertrain, most of the employment was preserved and exports still accounted for a fifth of the total — would that count as losing? Decide first whether "surviving" means the brands, the jobs or the profit, and the answer changes completely. The deepest lesson of the mirror may be that an industry's fate is first a question of definition — and only then a question of competition.
Appendix: key figures
| Area | Indicator | Figure | Source |
|---|---|---|---|
| Reserves | Car-related employment | 5.57M (8.0% of all employment) | JAMA, 2025 |
| Reserves | Car exports / share of total exports | ¥21.9tn / 19.9% | JAMA (Ministry of Finance data), 2025 |
| Reserves | Domestic production | 8.41M (1990 peak 13.49M, −38%) | JAMA, 2025 |
| Leader | Toyota global sales | 11.30M, No. 1 for 6 straight years | Toyota, calendar 2025 |
| Leader | Toyota operating profit | FY2025 ¥4.80tn (record) → FY2026 ¥3.77tn (automotive ¥2.78tn) | Toyota results |
| Comparison | Tesla operating profit | ~$2.1bn in the first nine months of 2026; Q3 operating margin 2.6% | Tesla 10-Q, 2026 |
| Comparison | BYD auto-segment gross margin | 20.49% (2025; 22.31% in 2024) | BYD 2025 annual report |
| Europe | Registration share, Q3 2026 | Chinese brands 12.7% / Japanese brands 11.9% (China 14.5% in September) | Dataforce, via Bloomberg |
| Europe | Chinese brands' hybrid share | HEV 14% / PHEV 25% (both 2% in 2024) | ACEA, H1 2026 |
| Europe | Countervailing duties on Chinese BEVs | 17.0%–35.3% (plus the 10% base duty; in force) | European Commission, 2024 |
| China | Japanese brands' passenger-car share | 23.1% (2020) → ~10% (Jan–Nov 2025) | CAAM series |
| China | Honda / Nissan sales | Honda 1.63M → 0.65M (2020→2025); Nissan 1.46M → 0.70M (2020→2024) | Company announcements |
| Southeast Asia | Japanese brands' share in Thailand | 92.3% (2010) → 69.3% (2025); Chinese brands 21.2% (2025) | Thai industry statistics |
| Speed | Development cycles | ~20 months in a sample of Chinese EV makers / ~40 months for traditional multinationals (sample limits in the text) | AlixPartners, 2024 |
| Technology | Digital capability index (Gartner) | Tesla first at 82.7; Toyota in the mid-20s, below 20th; Mazda last at 22.1 | Gartner index, 2026 (table as republished) |
| Technology | Electric share of new-car sales (2025) | World 25%; China ~55%, Europe 28%, US below 10%, Japan ~3% (incl. PHEV) | IEA, Global EV Outlook 2026 |
| Technology | Driving data and operations | Tesla FSD cumulative >15bn miles (L2, supervised); Waymo >500k fully driverless rides/week (L4) | Tesla company disclosures; Waymo disclosures, 2026 |
| Electrification | Toyota's BEV share | 1.4% (2024; ~140k of 10.16M) | Toyota releases |
| Electrification | Japan's domestic BEV share | 1.6% (2025, passenger cars) | Compiled from JAMA-affiliated statistics |
| Residuals | Chinese brands' 3-year value retention (Germany) | 47.2%, below the market average (sample mostly MG); UK forecast basis roughly level with non-Chinese models | DAT / CDL, 2026 |
| Mirror | Sony's image-sensor share | ~53% (by revenue) | Sony corporate report, 2024–2025 |
| Mirror | Fujifilm's revenue mix | Healthcare 32.7% + electronic materials 13.6%; imaging 18.7% | Fujifilm FY2025 results |

Sources & references
- Dataforce European registration figures (Q3 2026: Chinese brands 12.7%, Japanese brands 11.9%; September 14.5%), reported by Bloomberg (2026-10-26) https://businessmirror.com.ph/2026/10/26/chinese-carmakers-overtake-japan-in-europe-for-first-time/ ; JATO Dynamics (Chinese carmakers' European registrations ~50,000 in 2020 → ~700,000, with >1.3 million expected in 2026) https://www.jato.com/resources/news-and-insights/how-chinese-carmakers-are-changing-europe ; Japanese brands' 2021 share sums the five makes in ACEA's 2021 brand table (EU+EFTA+UK) at 11.1%: Toyota Group 760,178 + Nissan 249,232 + Mazda 155,434 + Mitsubishi 73,370 + Honda 68,346, out of a total market of 11,774,885 (that table does not list Suzuki or Subaru)
- ACEA new-car registrations release (EU, Jan–Sep 2026: HEV 36.3%, PHEV 10.1%, BEV 22.7%) https://www.acea.auto/pc-registrations/new-car-registrations-5-7-in-september-2026-year-to-date-battery-electric-22-7-market-share/ ; ACEA statement (2026-10-09: Chinese brands hold 14% of Europe's HEV market and 25% of its PHEV market, both 2% in 2024) https://www.acea.auto/press-release/acea-welcomes-eu-china-interim-deal-as-positive-step-towards-easing-trade-tensions/
- European Commission: countervailing duties on Chinese-made BEVs (Implementing Regulation (EU) 2024/2754, five years from 2024-10-30, in force; BYD 17.0%, Geely 18.8%, SAIC 35.3%, plus the 10% base duty) https://ec.europa.eu/commission/presscorner/detail/en/ip_24_5589 ; EU–China trade and investment consultations joint statement (2026-10-09; confirms only that hybrid trade will be handled in a "WTO-consistent" manner, with no figures) https://ec.europa.eu/commission/presscorner/api/files/document/print/en/statement_26_2122/STATEMENT_26_2122_EN.pdf ; details such as the 350,000/year hybrid cap were reported by Reuters citing EU officials (2026-10-12) https://auto.economictimes.indiatimes.com/news/industry/eu-eyes-december-trade-initiatives-after-china-car-import-deal/134894021
- European Commission, Industrial Accelerator Act proposal COM(2026) 100 final (2026-03-04; a proposal, not yet in force) https://ec.europa.eu/newsroom/growth/items/928572 ; the investment conditions (four of six) are from law-firm analyses of the proposal text https://www.jdsupra.com/legalnews/eu-industrial-accelerator-act-a-new-3030137/
- JAMA, The Motor Industry of Japan 2026 (employment 5.57M, production series, exports ¥21.9tn and 19.9%) https://www.jama.or.jp/english/reports/docs/MIoJ2026_e.pdf ; JAMA USA, 2026 Impact Report (US production above 3.1M) https://www.jama.org/2026-impact-report-powering-americas-automotive-industry/
- Toyota financial results: FY2025 operating profit ¥4.7955tn, FY2026 ¥3.7662tn (sales revenues ¥50.6849tn, group operating margin 7.4%); FY2026 segment operating profit — automotive ¥2.7770tn, financial services ¥851.7bn, other ¥132.0bn (Toyota results materials) https://www2.jpx.co.jp/disc/72030/140120260506517375.pdf ; FY2024 results materials (buyback ceiling ¥1tn, total dividends above ¥1tn, transformation investment ¥1.7tn) https://global.toyota/pages/global_toyota/ir/financial-results/2024_4q_presentation_2_en.pdf ; 2025 global sales of 11.3M (Toyota, via Reuters) https://www.businesstimes.com.sg/companies-markets/transport-logistics/toyota-retains-top-auto-crown-2025-record-sales
- China shares and volumes: Nomura research from CAAM-series data (2020 peak 23.1%) https://www.nomuraconnects.com/focused-thinking-posts/china-auto-industry-leverages-modular-production-to-become-ev-powerhouse/ ; CAAM via AP (Jan–Nov 2025: Japanese brands ~10%, Chinese brands ~70%) https://www.ndtv.com/auto/high-end-car-sales-sink-in-china-as-its-economy-slows-taking-a-toll-on-european-automakers-9805795 ; full-year shares by year: 17.8% in 2022 and 11.2% in 2024 (21st Century Business Herald, 2025-01-20) https://www.21jingji.com/article/20250120/herald/b23ecd77a1ad453356ef5848f5635d46.html ; Honda, Nissan and Toyota China sales are the companies' annual announcements (via Gasgoo and others) https://autonews.gasgoo.com/china_news/70017912.html
- Thailand: the 2024 share table is Toyota Thailand data (published by Ashu Research: Japanese brands 76.7%, Chinese brands 10.6% combined) https://cms.scout.asia/wp-content/uploads/2025/12/20251202-THB-01-00.pdf ; 2010's 92.3% and 2023's 77.8% were reported by Kyodo; 2025's Japanese 69.3% and Chinese 21.2% are Thai Automotive Association figures via 36Kr https://eu.36kr.com/en/p/3758882512548614 ; Indonesia is Gaikindo data compiled by PEFINDO (2024: top five Japanese makers 81.8% combined); Thailand's Chinese-brand ~11% for 2023 is Federation of Thai Industries data, via Jiemian
- Nissan: FY2024 net loss ¥670.9bn, FY2025 net loss ¥533.1bn https://global.nissannews.com/en/releases/260513-01-e ; Re:Nissan plan (20,000 jobs, plants 17→10, ¥500bn cost reduction) https://global.nissannews.com/en/releases/250513-02-e ; Honda–Nissan merger talks terminated (joint release, 2025-02-13) https://global.nissannews.com/en/releases/250213-00-e ; Chery–Nissan Sunderland contract-manufacturing memorandum (2026-06-03, non-binding) https://global.nissannews.com/en/releases/260603-02-e
- AlixPartners, 2024 Global Automotive Outlook (development cycles of ~20 months in a sample of Chinese EV makers vs ~40 months for traditional multinationals; average model age 1.6 years for Chinese brands vs 5.4 years for foreign brands) https://www.alixpartners.com/newsroom/2024-alixpartners-global-automotive-outlook/ ; McKinsey (Chinese newcomers ~21 months from concept to production; 36–48 months elsewhere) https://www.mckinsey.com/featured-insights/insights-on-europe/productivity-reimagined
- Electrification company figures: Toyota's 2024 sales mix (BEVs 139,892 of 10,159,336 total; Toyota releases, as republished); Japan's domestic BEV share of 1.6% (2025; compiled from JAMA-affiliated and light-vehicle association statistics) https://blog.evsmart.net/t/electric-vehicle-sales-in-japan/690 ; Honda business briefings (the 2024 ¥10tn plan) https://global.honda/en/newsroom/news/2024/c240516eng.html and the 2025 cut to ¥7tn (Reuters, reporting Honda's briefing)
- Chinese auto industry margins: National Bureau of Statistics data compiled by Cui Dongshu of the CPCA (4.3% in 2024); the 2026 China Automotive Supply Chain Development Report (citing CAAM's Chen Shihua: finished-vehicle manufacturing excluding parts below 2% for Jan–Aug 2026) https://www.sohu.com/a/1091941180_99917178
- Solid-state batteries: Toyota–Idemitsu joint release (2023-10-12; commercialisation in 2027–2028) https://global.toyota/en/newsroom/corporate/39865919.html ; Idemitsu (2026-05-20; large pilot plant to be completed within 2027) https://www.idemitsu.com/jp/news/2026/260520_en.pdf ; Nissan (pilot line running since January 2025; fitment targeted for fiscal 2028) https://global.nissannews.com/en/releases/nissan-partners-with-licap-technologies-to-develop-assb-electrode-production-process-technology
- Automotive News (2026-10-26): Toyota's external powertrain orders of about €500M ($560M) in 2026 and about €1.5bn ($1.7bn) in 2032, as disclosed by Toyota's chief technology officer at an investor event; Toyota has issued no formal press release and no buyers are confirmed https://www.autonews.com/toyota/an-toyota-selling-next-generation-engines-1026/
- Residual values: DAT, DAT Report 2026 (published January 2026; three-year value retention, Chinese brands 47.2%, with a small, mostly-MG sample; via Automobilwoche and other reporting) https://automobilemagazine.com.tr/noch-schwache-restwerte-bei-chinesischen-autobauern ; UK CDL forecast data via Auto Express (Chinese models' forecast retention 46.16% vs 46% for non-Chinese) https://www.autoexpress.co.uk/exclusive/370471/chinese-cars-now-beat-mainstream-models-depreciation-just-about ; KBA (German commercial registration share) https://www.kba.de/DE/Service/Nachrichten/2024/PM/PM_Nr_37_2024_Fahrzeugzulassungen_10_2024.html . Note: this revision removes the Aampere auction index cited in the previous version — its methodology (sample and model mix) could not be verified
- European localisation, by stage: BYD's Szeged plant announced in December 2023 https://media.byd.com/byd-to-build-a-new-energy-passenger-vehicle-factory-in-hungary-for-localised-production-in-europe/ , with trial production starting at the end of January 2026 (company and Hungarian-media accounts; the company says mass production starts in Q4 2026, with no output disclosed); Chery–Ebro Barcelona restarted production in November 2024 (2025 output about 17,308 vehicles, all EBRO brand, per media reports); Stellantis (Leapmotor B10 production start in Zaragoza, 2026-10-16) https://www.media.stellantis.com/em-en/leapmotor/press/stellantis-and-leapmotor-officially-start-b10-production-in-zaragoza-turning-their-alliance-into-a-european-industrial-reality ; the Geely–Ford Valencia joint venture (2026-07-23; agreement stage, first cars expected in 2028) https://global.geely.com/en/news/2026/geely-ford-joint-venture-spain-valencia-plant ; SAIC's Galicia plant has been announced as a plan (Reuters, June 2026; production targeted for 2028), with construction not started and central approval incomplete https://www.reuters.com/world/china/chinas-saic-plans-build-first-eu-car-plant-spains-galicia-2026-06-01/ ; BYD's Turkish plant, announced in July 2024, has been shelved — never built, import-tax privileges suspended (Reuters, June 2026)
- White-goods transactions (the companies' announcements at the time): Haier's acquisition of Sanyo's washing-machine and household-refrigerator businesses (final agreement, 2011-10-18) https://www.haier.com/ph/about-haier/news/20190912_105722.shtml ; Sharp and Hon Hai joint release (2016-03-30; 66%, about ¥388.8bn) https://global.sharp/corporate/news/160330.pdf ; Toshiba Lifestyle's 80.1% transfer to Midea (2016-03-30) https://www.global.toshiba/ww/news/corporate/2016/03/pr3001.html ; 60% of Hitachi's overseas appliance business to the Arçelik joint venture (2020-12-16) https://www.hitachi.com/en/press/articles/2020/12/1216/
- Sony: image-sensor share of about 53% (Corporate Report 2025, CY2024) https://www.sony.com/en/SonyInfo/IR/library/corporatereport/CorporateReport2025_E.pdf ; the home-entertainment joint venture with TCL (formal agreement 2026-03-31; TCL 51%) https://www.sony.co.jp/en/news-release/202603/26-0331E/ ; Fujifilm FY2025 results materials (healthcare ¥1.0989tn, electronic materials ¥456.2bn, imaging ¥627.1bn, total revenue ¥3.357tn) https://ir.fujifilm.com/en/investors/ir-materials/earnings-presentations/main/01113/teaserItems5/00/linkList/0/link/ff_fy2025q4_001e.pdf ; Kodak filed for bankruptcy protection on January 19, 2012 (company filings)
- Gartner, Digital Automaker Index 2026 (scores for 24 makers across nine categories: Tesla 82.7 first, NIO 73.1, Xiaomi 69.2, XPeng 57.7, Li Auto 57.0, Rivian 55.5, Lucid 45.3, BYD 43.6, Geely 41.1, Hyundai-Kia 37.5 tenth, Mercedes-Benz 35.8 eleventh; Nissan 23rd, Mazda 24th at 22.1), full table as republished by eletric-vehicles.com https://eletric-vehicles.com/general/tesla-chinese-brands-lead-gartner-digital-index-as-ai-widens-gap/ ; Nissan and Mazda as the bottom two per Motley Fool reporting https://www.mitrade.com/au/insights/news/live-news/article-8-2035846-20260827 ; Toyota's score in the mid-20s and ranking below 20th per South Korea's ET News https://en.etnews.com/20260928200012 ; the index report itself (paywalled) https://www.gartner.com/en/documents/8258257
- IEA, Global EV Outlook 2026 (published 2026-05-20), executive summary: 2025 global electric car sales above 20 million, 25% of new cars; Europe 4.2 million, 28%; China above 13 million, nearly 55%; the United States below 10% https://www.iea.org/reports/global-ev-outlook-2026/executive-summary ; Japan's sales of about 100,000, under 3% of its market (report text, as republished)
- Toyota's Arene plans: Reuters reporting (2026-10-16; all ~50 models to become SDVs by 2030, Arene fitted to ~10 million new cars a year, offered to alliance partners from around 2035; confirmed by a Toyota spokesperson; Arene first fitted to the 2025 RAV4 and currently on two models) https://www.newsweekjapan.jp/articles/-/337204 ; the Honda–Nissan agreement: joint development and standardisation of core ECUs, vehicle OS, key middleware and vehicle-control software, for fitment from fiscal 2029 (Nissan press release, 2026-08-31) https://global.nissannews.com/en/releases/260831-01-e
- Chip platforms: NVIDIA press release (2025-01-06, CES; Toyota's next-generation vehicles to use DRIVE AGX Orin and the safety-certified DriveOS) https://www.motor.com/2025/01/toyota-aurora-and-continental-join-growing-list-of-nvidia-partners-rolling-out-next-generation-highly-automated-and-autonomous-vehicle-fleets/ ; Sony Honda Mobility's adoption of Qualcomm's Snapdragon Digital Chassis in its next-generation E/E architecture (announced at CES 2026, as reported) https://www.automotiveworld.com/news/sony-honda-mobility-unveils-afeela-prototype-2026/ ; Renesas's R-Car X5H (3nm multi-domain SoC, 400 TOPS; announced November 2024, mass production targeted for 2027), a Renesas release as reported by industry media https://eu.36kr.com/en/p/3631541934425093
- Waymo's operating scale (company-stated: more than 500,000 paid rides a week in September 2026, 14 US metropolitan areas, a fleet above 4,000, and a target of one million a week by year-end) https://www.stockmoguls.com/2026/09/03/waymo-now-runs-500000-rides-a-week-a-48-billion-industry-is-taking-shape/ ; Baidu Apollo Go (company-stated: 3.2 million fully driverless rides in Q1 2026, a weekly peak above 350,000 in March, cumulative rides above 22 million by April 2026) https://electrek.co/2026/06/16/baidu-apollo-go-amigo-switzerland-level-4-approval/
- Japan's autonomous-driving state: the Waymo–GO–Nihon Kotsu commercialisation agreement (2026-09-15; targeting a driverless taxi service launch in Tokyo in 2027, about 100 vehicles initially, approval still to come; driver-accompanied testing in seven Tokyo wards since 2025) https://waymo.com/blog/2026/09/opening-tokyo-in-2027-with-nihon-kotsu-go/ ; Tier IV's L4 architecture entering demonstrations at 50 locations across Japan from 2026 (company release, as reported) https://www.just-auto.com/newsletters/tier-iv-level-4/?type=Analysis&utm_source=&utm_medium=&utm_content=Other_Daily_News_Articles&utm_campaign=type3_automotive-market
- Tesla's financials and operations (SEC and company disclosures): Q3 2026 Form 10-Q (total revenues $28,046M; total automotive revenues $20,560M, including $113M of regulatory credits; automotive gross profit $3,806M, an 18.5% margin — about 18.1% excluding credits, our calculation from the 10-Q; group operating income $718M, a 2.6% margin; operating income of $2,057M for the first nine months of 2026; deferred revenue related to FSD features of $4,080M) https://www.sec.gov/Archives/edgar/data/1318605/000162828026066775/tsla-20260930.htm ; Q3 2026 deliveries of 486,532 (Tesla IR release, 2026-10-02) https://ir.tesla.com/press-release/tesla-third-quarter-2026-production-deliveries-and-deployments ; cumulative FSD (Supervised) miles above 15 billion by end-September 2026 (company disclosure, via media reporting); about 1.74 million active FSD customers, one-time purchases and subscriptions combined (company shareholder materials, via media reporting) — the monthly-subscriber split and FSD revenue are not disclosed; about 3.11 million driverless miles without a safety monitor, January to mid-October 2026 (Tesla, Robotaxi Safety Report, October 2026, company-stated); Cybercab entered service in September 2026 (10-Q); NHTSA has opened a compliance investigation into Cybercab (Reuters, October 2026)
- BYD's financials (annual report and HKEX disclosures): the 2025 annual report — revenue of ¥803.96bn, net profit attributable of ¥32.62bn, overall gross margin of 17.74%; the automobiles, automobile-related products and other segment's revenue of ¥648.65bn (80.68% of the total) and segment gross margin of 20.49% (22.31% in 2024, annual-report figures via Reuters); 2025 new-energy vehicle sales of 4,602,436 (including commercial vehicles; passenger vehicles 4,545,423). The 2026 interim results announcement — first-half revenue of ¥344.82bn, net profit attributable of ¥12.33bn, overall gross margin of 18.85%, auto-related segment gross margin of 22.33% (interim report) https://www1.hkexnews.hk/listedco/list_announcements/byd/2026/0828/2026082801343.pdf
- Toyota's "non-vehicle" target: first reported by Nikkei (2026-09-07; Toyota plans to raise operating profit from businesses other than new-vehicle sales to ¥3 trillion by fiscal 2030, up about 40% from a fiscal-2025 base of roughly ¥2.1 trillion); reported again on 2026-10-16 by Asahi and others, with Toyota's PR confirming the Arene rollout plan (about 50 SDV models by 2030). The measure covers genuine parts, sales finance, leasing, used cars and software updates, cuts across the reported segments, is not a formal Toyota release and cannot be tracked from segment data; we cite it at the level of reporting
- Japan's commercial Level 4 history (official): Eiheiji's Level 4 service (operated by ZEN Connect) began operating on May 28, 2023 — Japan's first fare-charging Level 4 service under the revised Road Traffic Act's "specified automated operation" permit system (in force from April 1, 2023) (MLIT and Eiheiji town materials); Haneda Innovation City's Level 4 bus was permitted in 2024 and runs free of charge (the facility and BOLDLY); Sakai town, Ibaraki's scheduled bus obtained its permit in November 2025; the government targets automated-driving services at more than 100 locations by the end of fiscal 2027 (MLIT automated-driving promotion materials); the Eiheiji service has been suspended since April 2026 (Fukui Shimbun); only nine specified-automated-operation permits existed nationwide at the end of 2025 (MLIT data compiled by Jidounten Lab)
- The Toyota–Waymo collaboration (joint announcement by both companies, April 2025): a preliminary collaboration on developing and deploying autonomous-driving technology for personally owned vehicles, exploring the integration of Waymo's technology into Toyota's personally owned vehicles, with Woven by Toyota participating https://global.toyota/en/newsroom/corporate/ ; the Toyota–NTT joint announcement (2024-10-31): a combined ¥500 billion investment by 2030 to build mobility AI platforms and software infrastructure
- A note on the layer framework: the six-layer technology stack in Act II is this publication's analytical structure. The factual basis for each layer's attribution is sources 21 (Arene and fitment progress), 22 (the scope of NVIDIA's and Qualcomm's supply) and 29 (the form of the Toyota–Waymo collaboration). Arene's three-part positioning (abstracting hardware differences, development tools, data) is Toyota's and Woven's official description, as carried by industry reporting
- Tesla, Inc., Form 10-K for fiscal 2025 (filed with the SEC on Jan 29, 2026): total revenues $94,827M, income from operations $4,355M — a group operating margin of about 4.6% https://www.sec.gov/Archives/edgar/data/1318605/000162828026003952/tsla-20251231.htm
- Toyota official releases (software updates and Arene): Lexus NX world premiere (Jun 12, 2021 — OTA via DCM covers the multimedia system, gauges and audio, and can enhance advanced safety equipment) https://global.toyota/en/newsroom/lexus/35290949.html ; LS and Mirai with Advanced Drive (April 2021 — driver-assistance control software and high-precision map software updatable wirelessly or by dealer cable) https://global.toyota/en/newsroom/corporate/35063150.html ; bZ4X Japan launch (Apr 12, 2022 — Toyota Safety Sense and the multimedia system updatable over the air) https://global.toyota/en/newsroom/toyota/37135919.html ; new RAV4 world premiere (May 21, 2025 — first production use of Arene, developed by Woven by Toyota) https://global.toyota/en/newsroom/toyota/42758168.html ; Woven by Toyota (Apr 11, 2023 — Arene as a comprehensive software platform and vehicle operating system) https://global.toyota/en/newsroom/corporate/39070846.html
- Tesla official support pages: Software Updates (vehicles receive over-the-air updates over Wi-Fi that add new features and enhance existing ones) https://www.tesla.com/support/software-updates ; Autopilot and Full Self-Driving Capability (driver-assistance capabilities continuously upgraded through over-the-air updates) https://www.tesla.com/en_ae/support/autopilot
- US share (computed by this magazine): combined US sales of the six Japanese makers (Toyota, Honda, Nissan, Subaru, Mazda, Mitsubishi; company releases — 5.337m in 2020, 4.755m in 2022, 5.882m in 2024, 6.023m in 2025 — as compiled each January by Jiji Press and Nikkan Kogyo Shimbun) divided by total US new-car sales (Motor Intelligence, via JETRO's annual reports: 14.581m in 2020, 13.903m in 2022, 16.043m in 2024, 16.356m in 2025) https://www.jetro.go.jp/biz/areareports/2026/6d75d491aa82ee56.html
Spotted an error or something out of date? Let us know via the contact page. Corrections are reflected in the updated date.
Original research and analysis by JNoted. Please cite with a link; full republication or commercial use requires prior permission.